Sherry Duong

Curiously exploring the world with Python and SQL.
Email: sherryduong@gmail.com
LinkedIn: sherry-duong
Github: sherryduong93
View My Resume
Impact of the Chase Stadium on Mission Bay/Dogpatch Crime Incidents and Fire Department Call Volume
Are Sports Fans Causing an Uptick in Police Incidents or Fire Department Call Volume?
San Francisco has been home to the AT&T Stadium for many years now, and while the stadium is a great source of joy for many, it is also a source of pain for locals.
For example, have you ever been late to an engagement because you were stuck on an overcrowded, tardy, and broken down Caltrain/Muni, filled with the light scent of alcohol and a sea of orange/black jerseys?
If so, you’ve likely been impacted by a Giants game! Frequent and powerful, Giants games have the power to bring many folks together, and also, hold them together on public transit. It has even gotten to a point where a website has been created to inform you whether or not there is a Giants game today: www.isthereagiantsgametoday.com.
Because of this, I was curious to see if this surge of sports fans had an impact on more than just my daily commute, and I decided to look into this with a smaller subset of data: the recent opening of the Chase Center Stadium - home to the Golden State Warriors.
Datasets & Exploratory Analysis
Dataset 1: Fire Department Calls for Service
-Data: 5243306 entries, 44 columns

Null Values:

-14297 entries in “zipcode”

-DtTm for specific incidents of the call are also missing, this may be interesting to look into if time permits, but not entirely necessary
Data Cleaning
Zipcodes of interest ‘94107’,'94103', ‘94158’, ‘94105’

Added 600 values for zipcode 94158

Call Types of interest: 'Train / Rail Incident', 'Odor (Strange / Unknown)', 'Explosion','Traffic Collision','Alarms', 'Structure Fire', 'Other', 'Medical Incident’
Interesting Finds
In general, the calls to the Fire Department have been increasing year over year, even when normalizing for population growth.
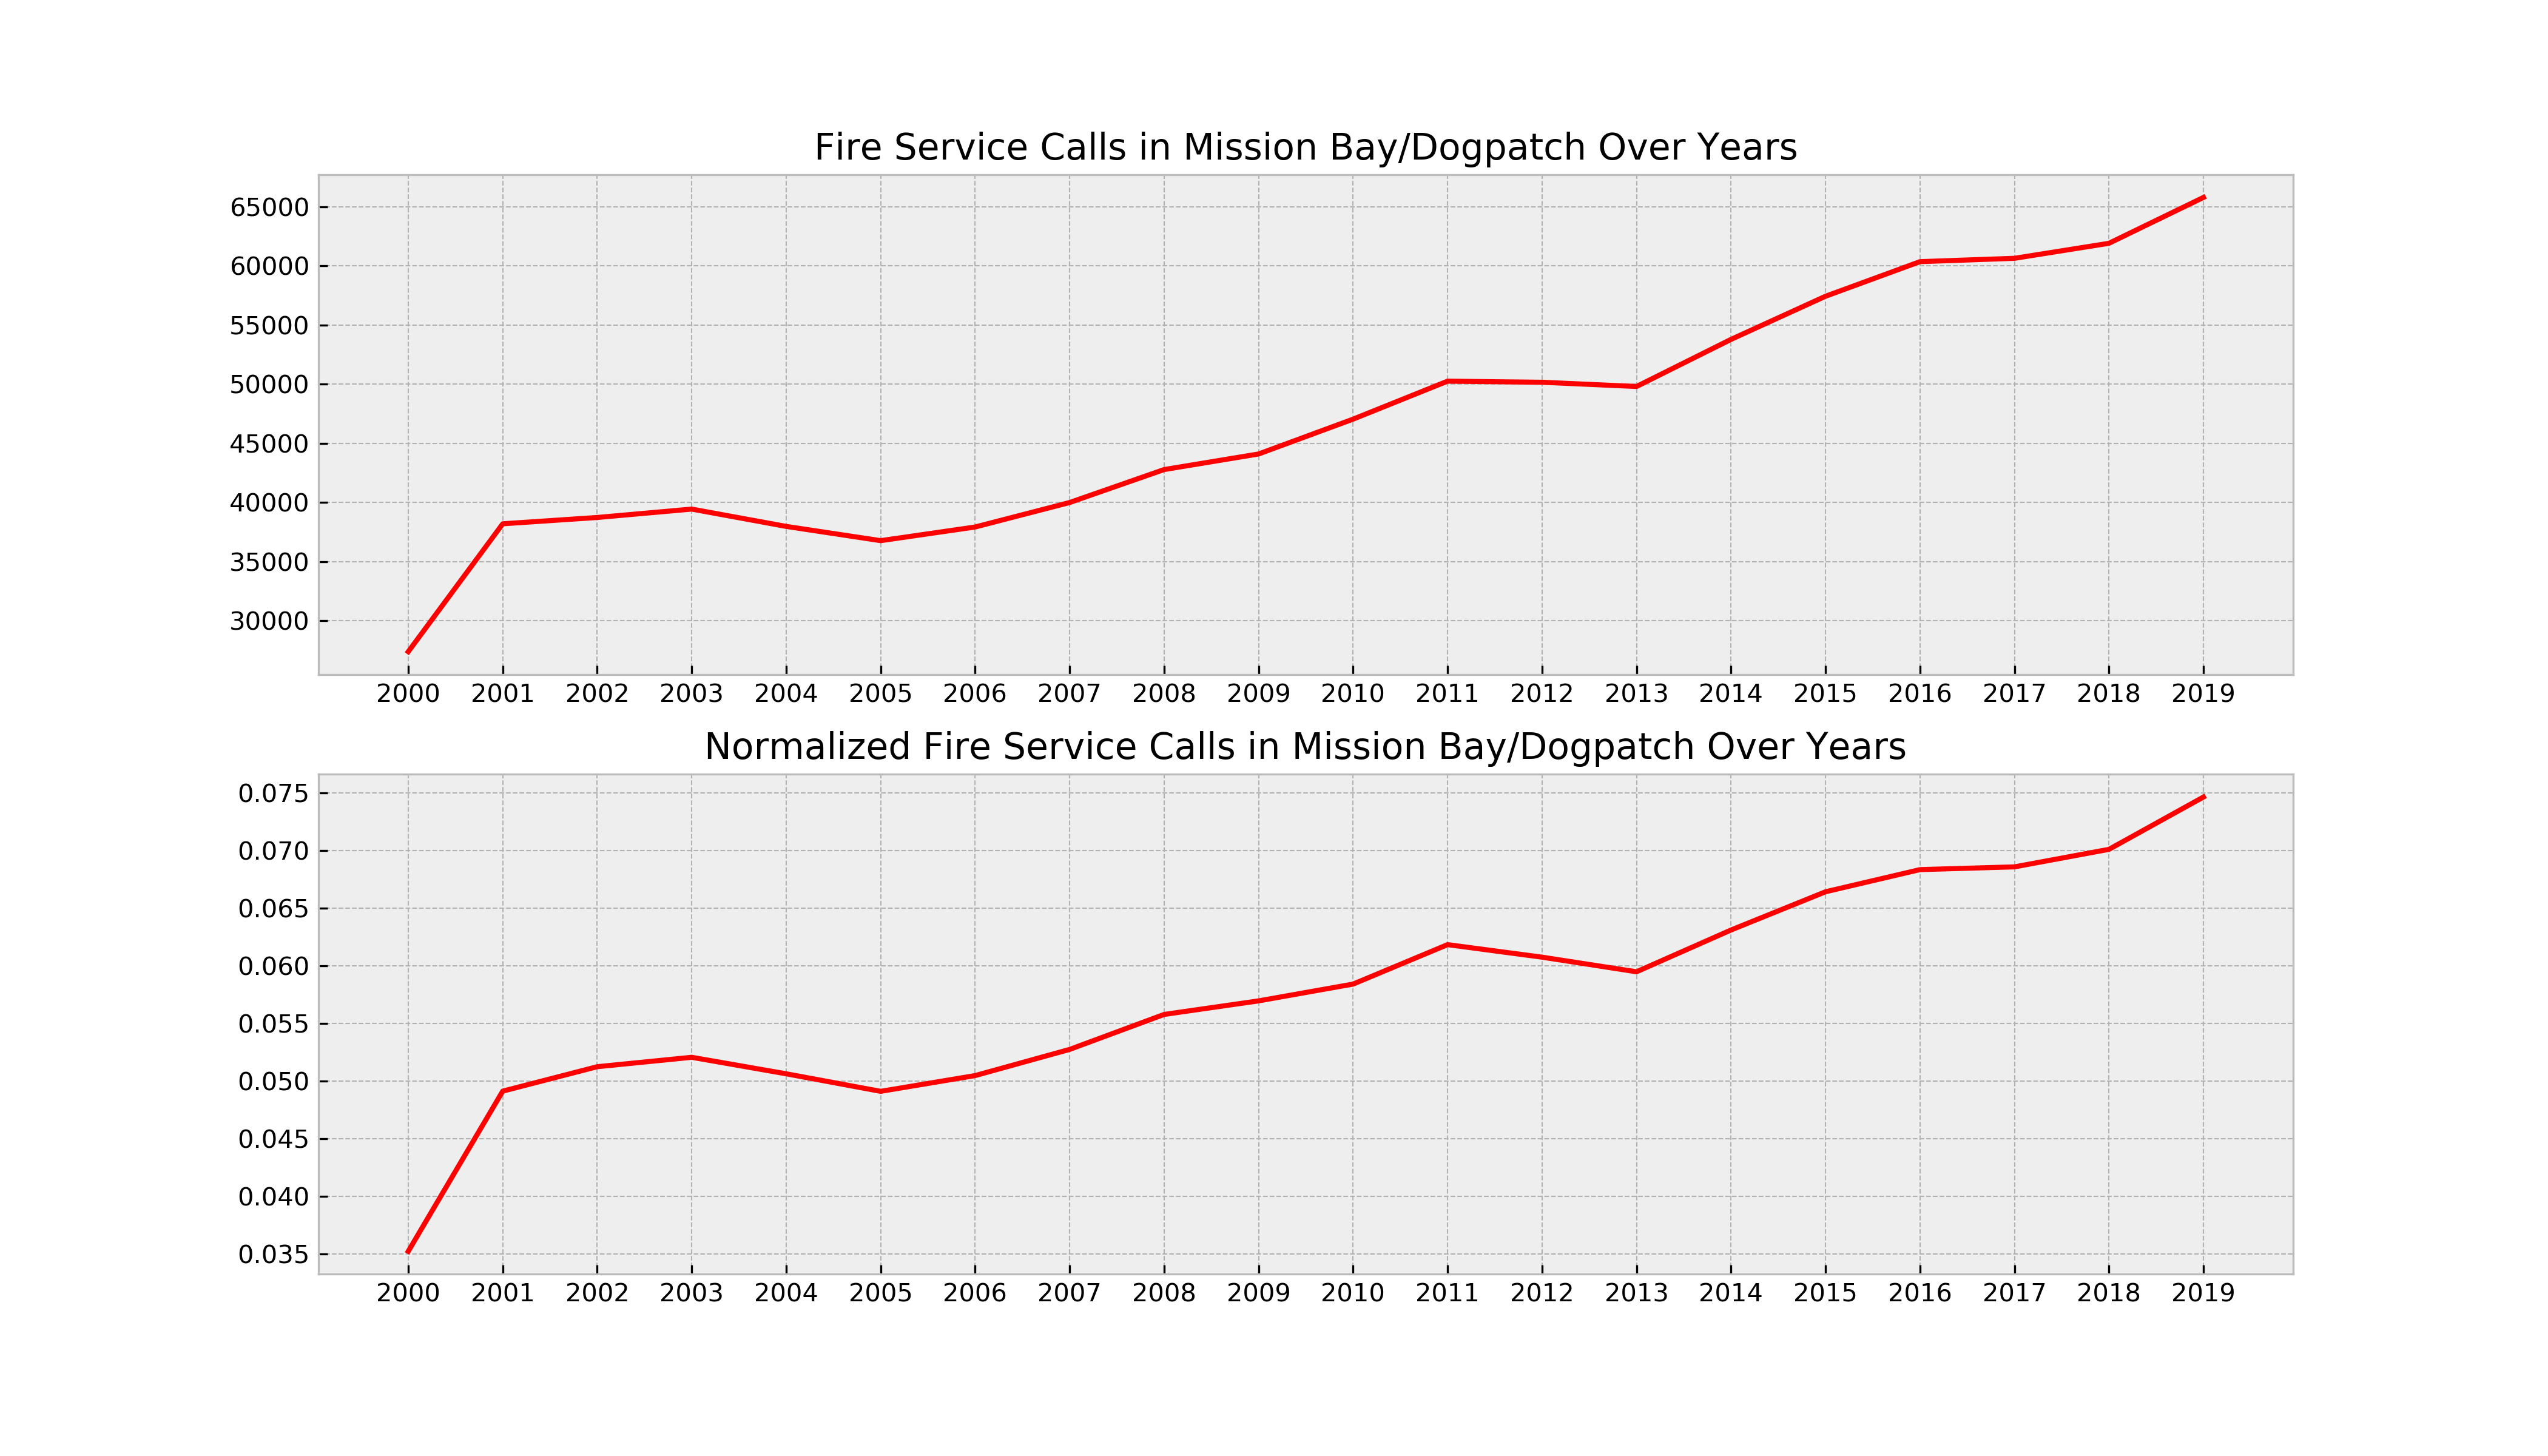 There is also some seasonality of the data, with peaks at the beginning of each season and lows mid-season.
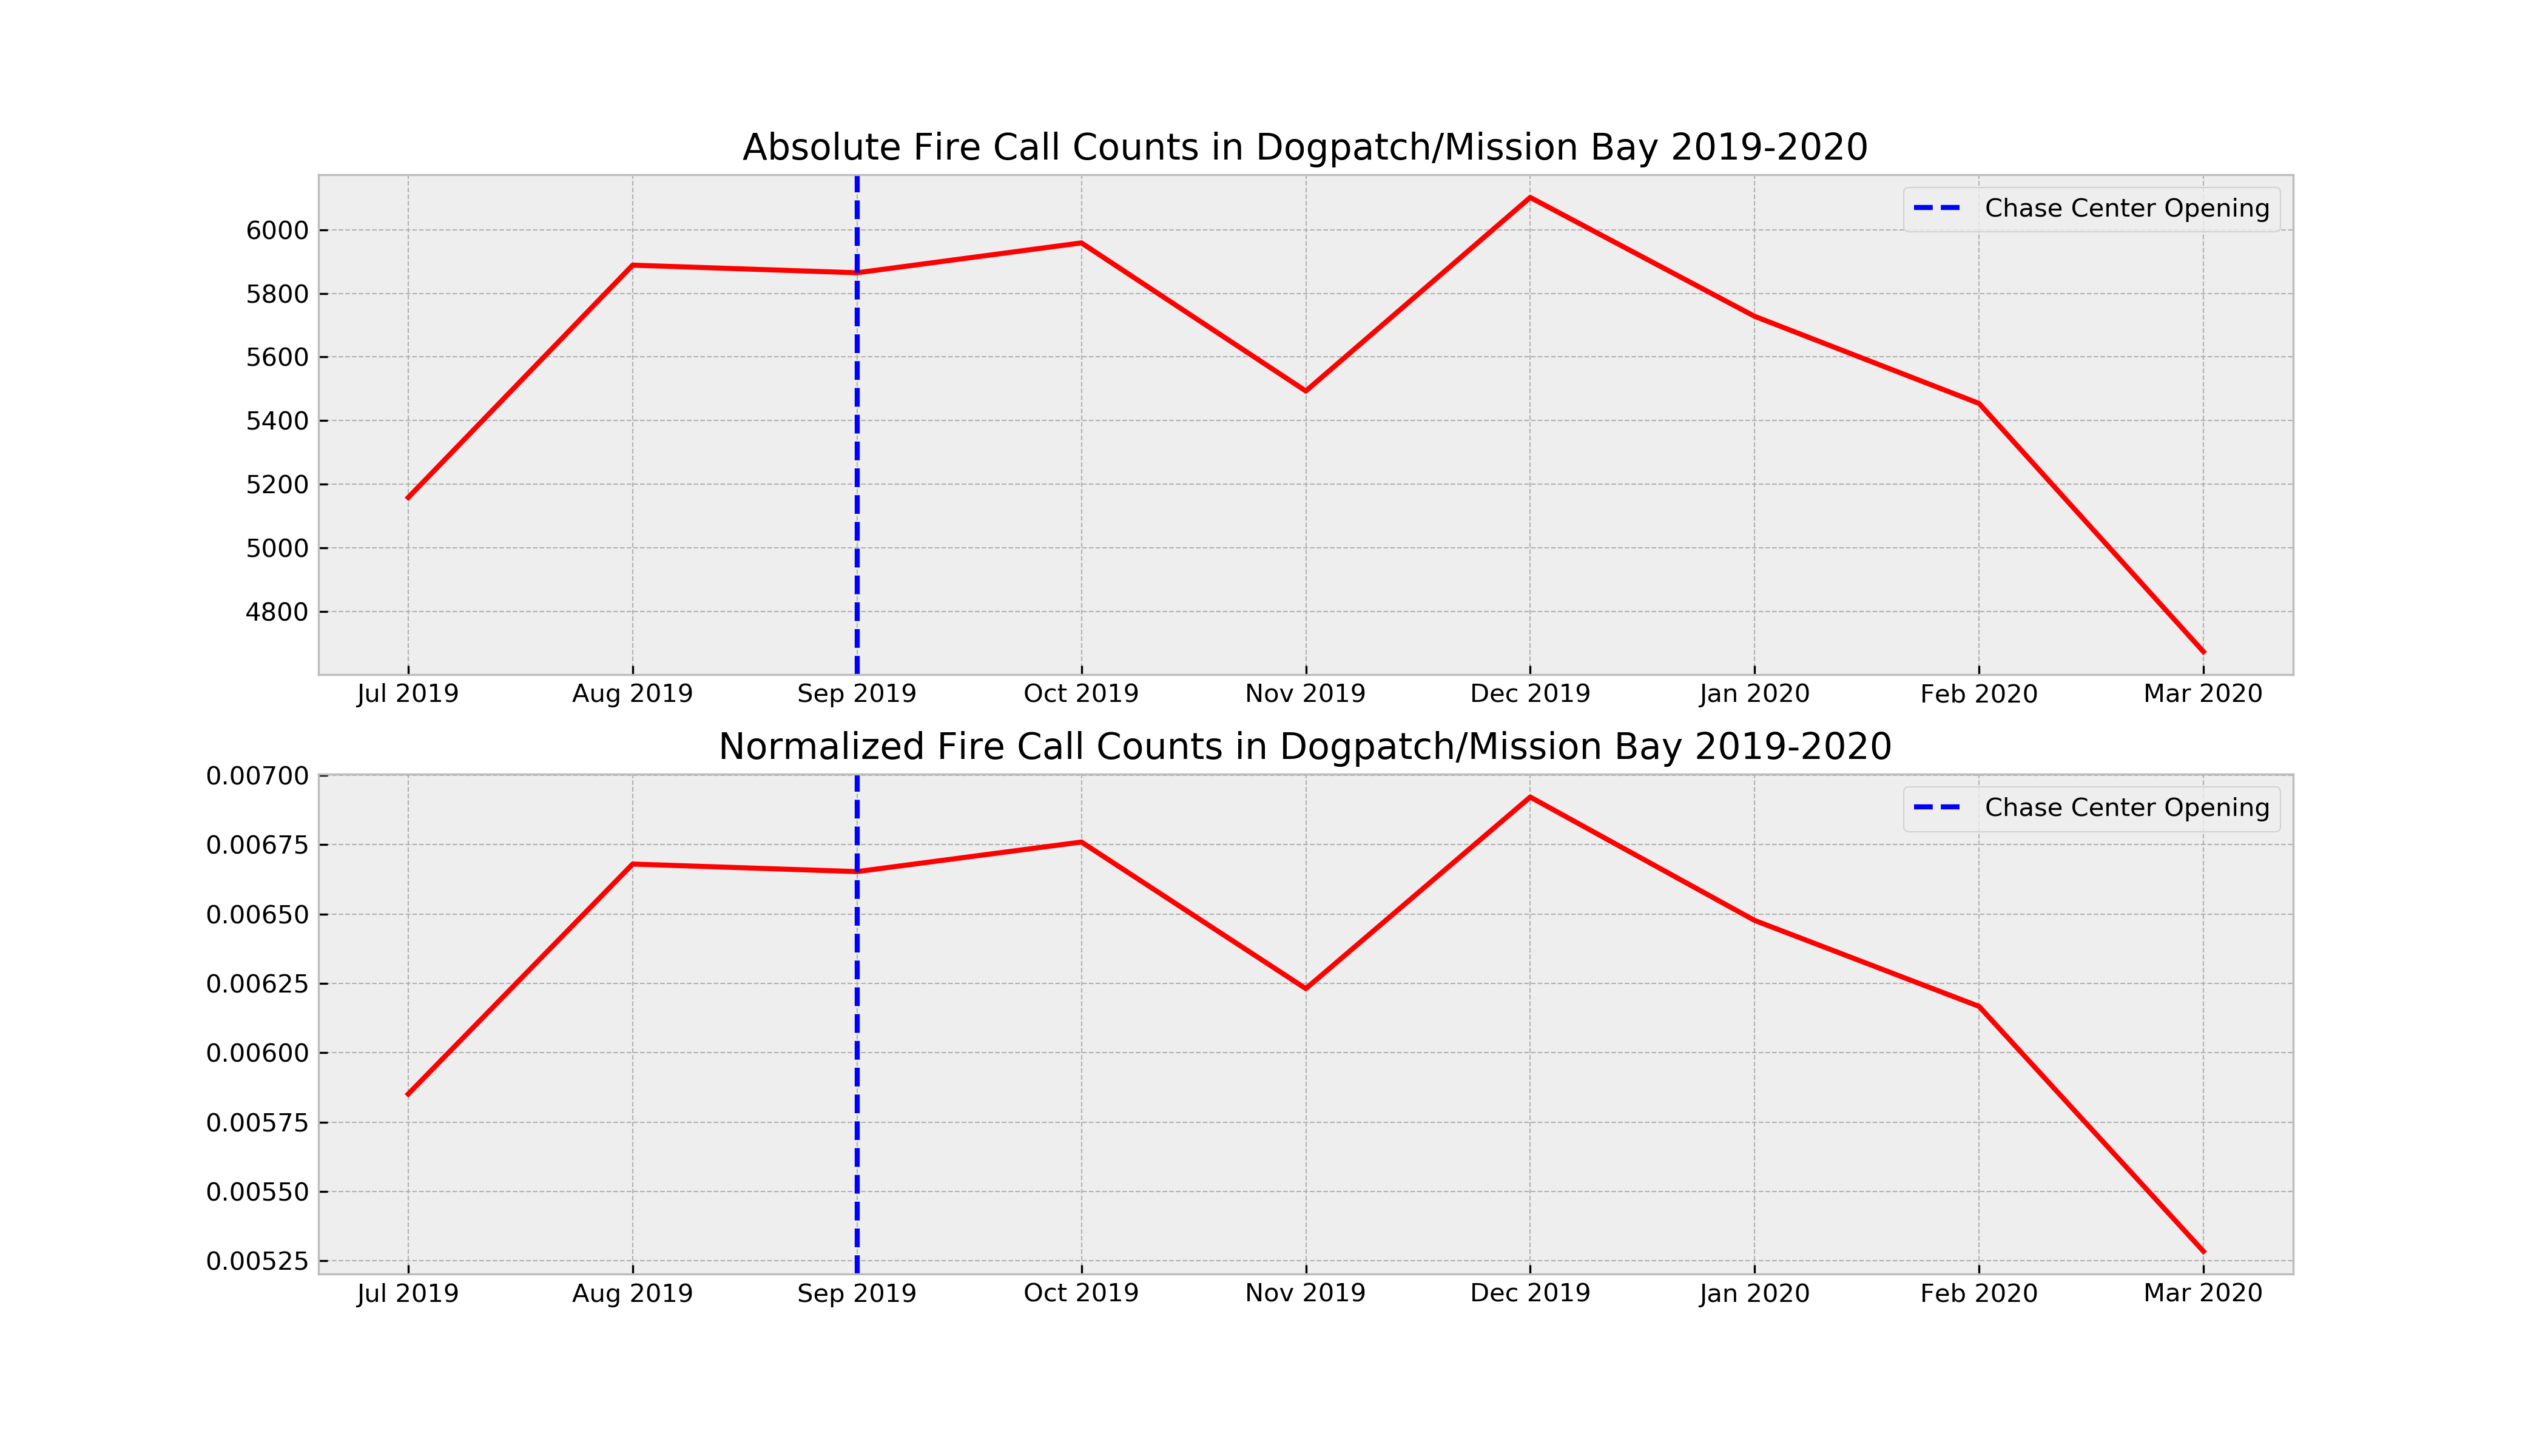
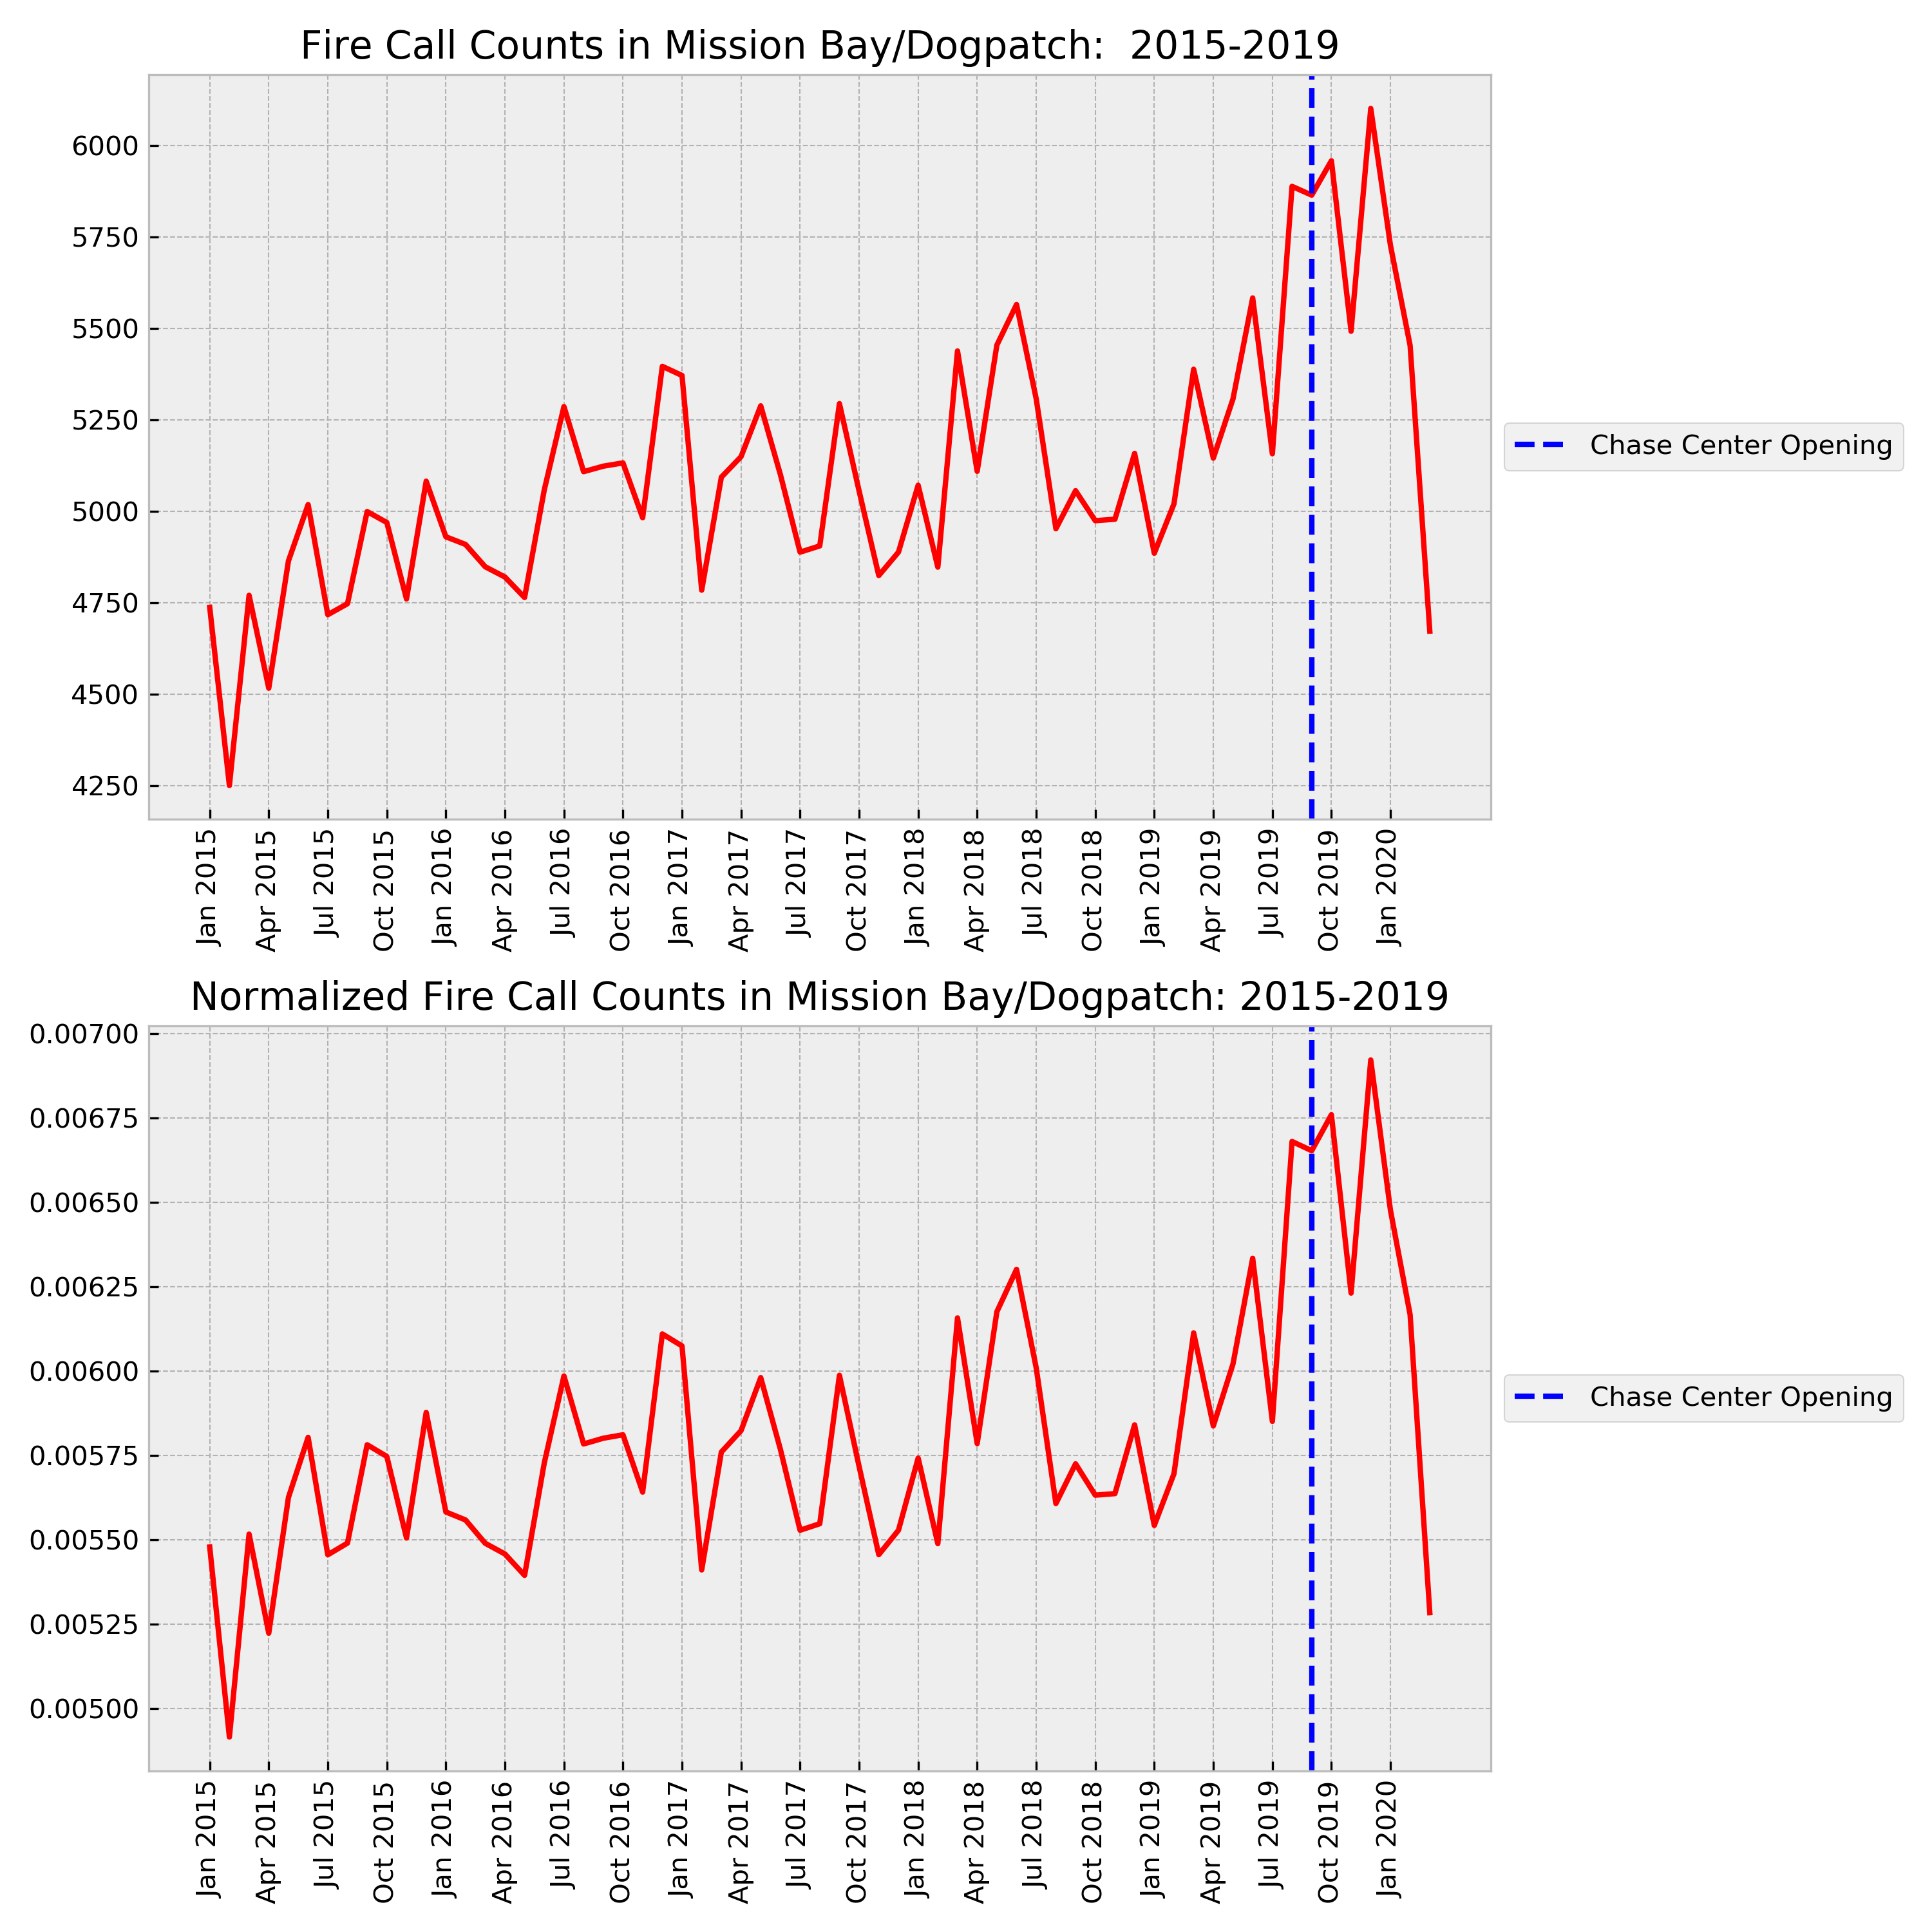 However, when looking into 2020, the call volume seems to have dropped, but this is also due to the fact that it is the “low” part of the seasonal volume, and we would expect to see an uptick in April based on current trend. Because of this, I will proceed with hypothesis testing only comparing dates after the stadium opened.
Dataset 2: Police Incidents
Report 1 (2003 - 2018)
 -2215024 entries, 33 columns

-Do not have zip code or neighborhood, only address, Latitude & Longitude
Report 2 (2018 - Present)
-332828 entries, 36 columns

-Categories of Interest: 'Non-Criminal','Stolen Property','Miscellaneous Investigation','Other Miscellaneous’, 'Assault', 'Larceny Theft', 'Malicious Mischief', 'Disorderly Conduct', ‘Other', 'Suspicious Occ', 'Disorderly Conduct','Traffic Collision', 'Liquor Laws', 'Fire Report', 'Suspicious'
Data Cleaning
Calculated the harversine distance between the latitude/longitude of all rows in data and the known latitude/longitude of all zipcodes in SF. Was able to estimate the zipcode in order to narrow down to the same zipcodes used for the Fire Department Analysis.
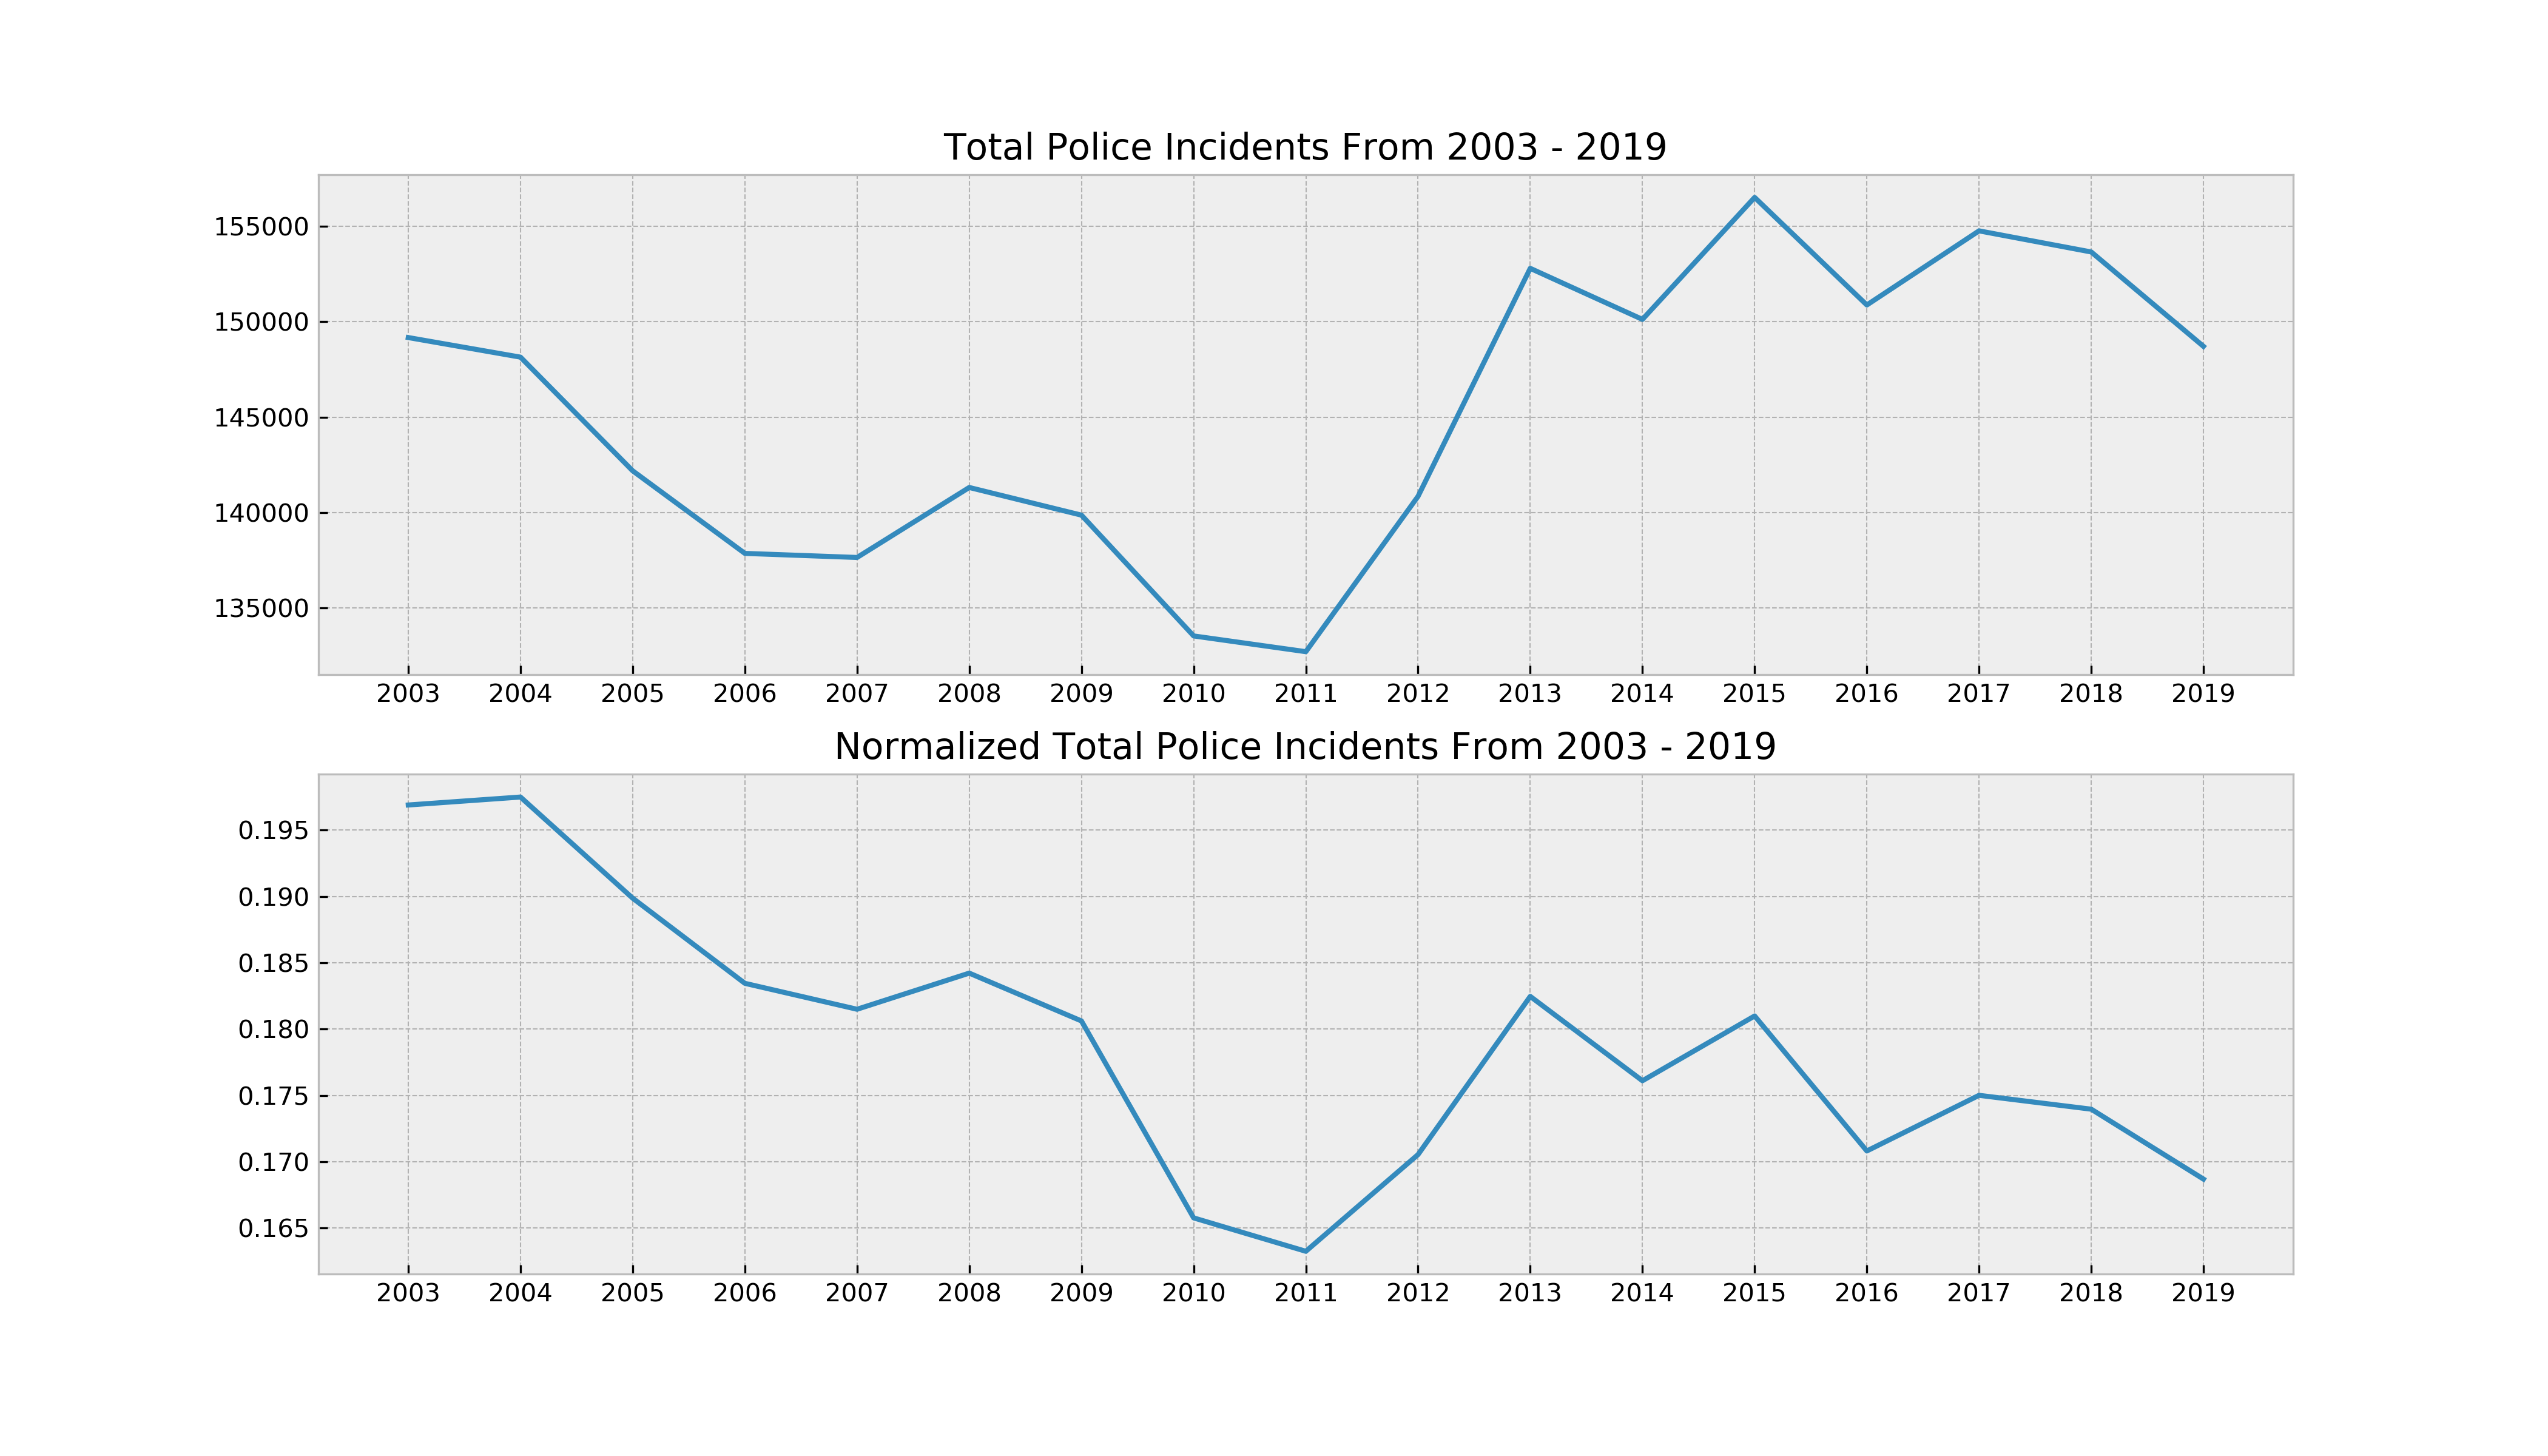
General EDA on Police Incidents as a whole
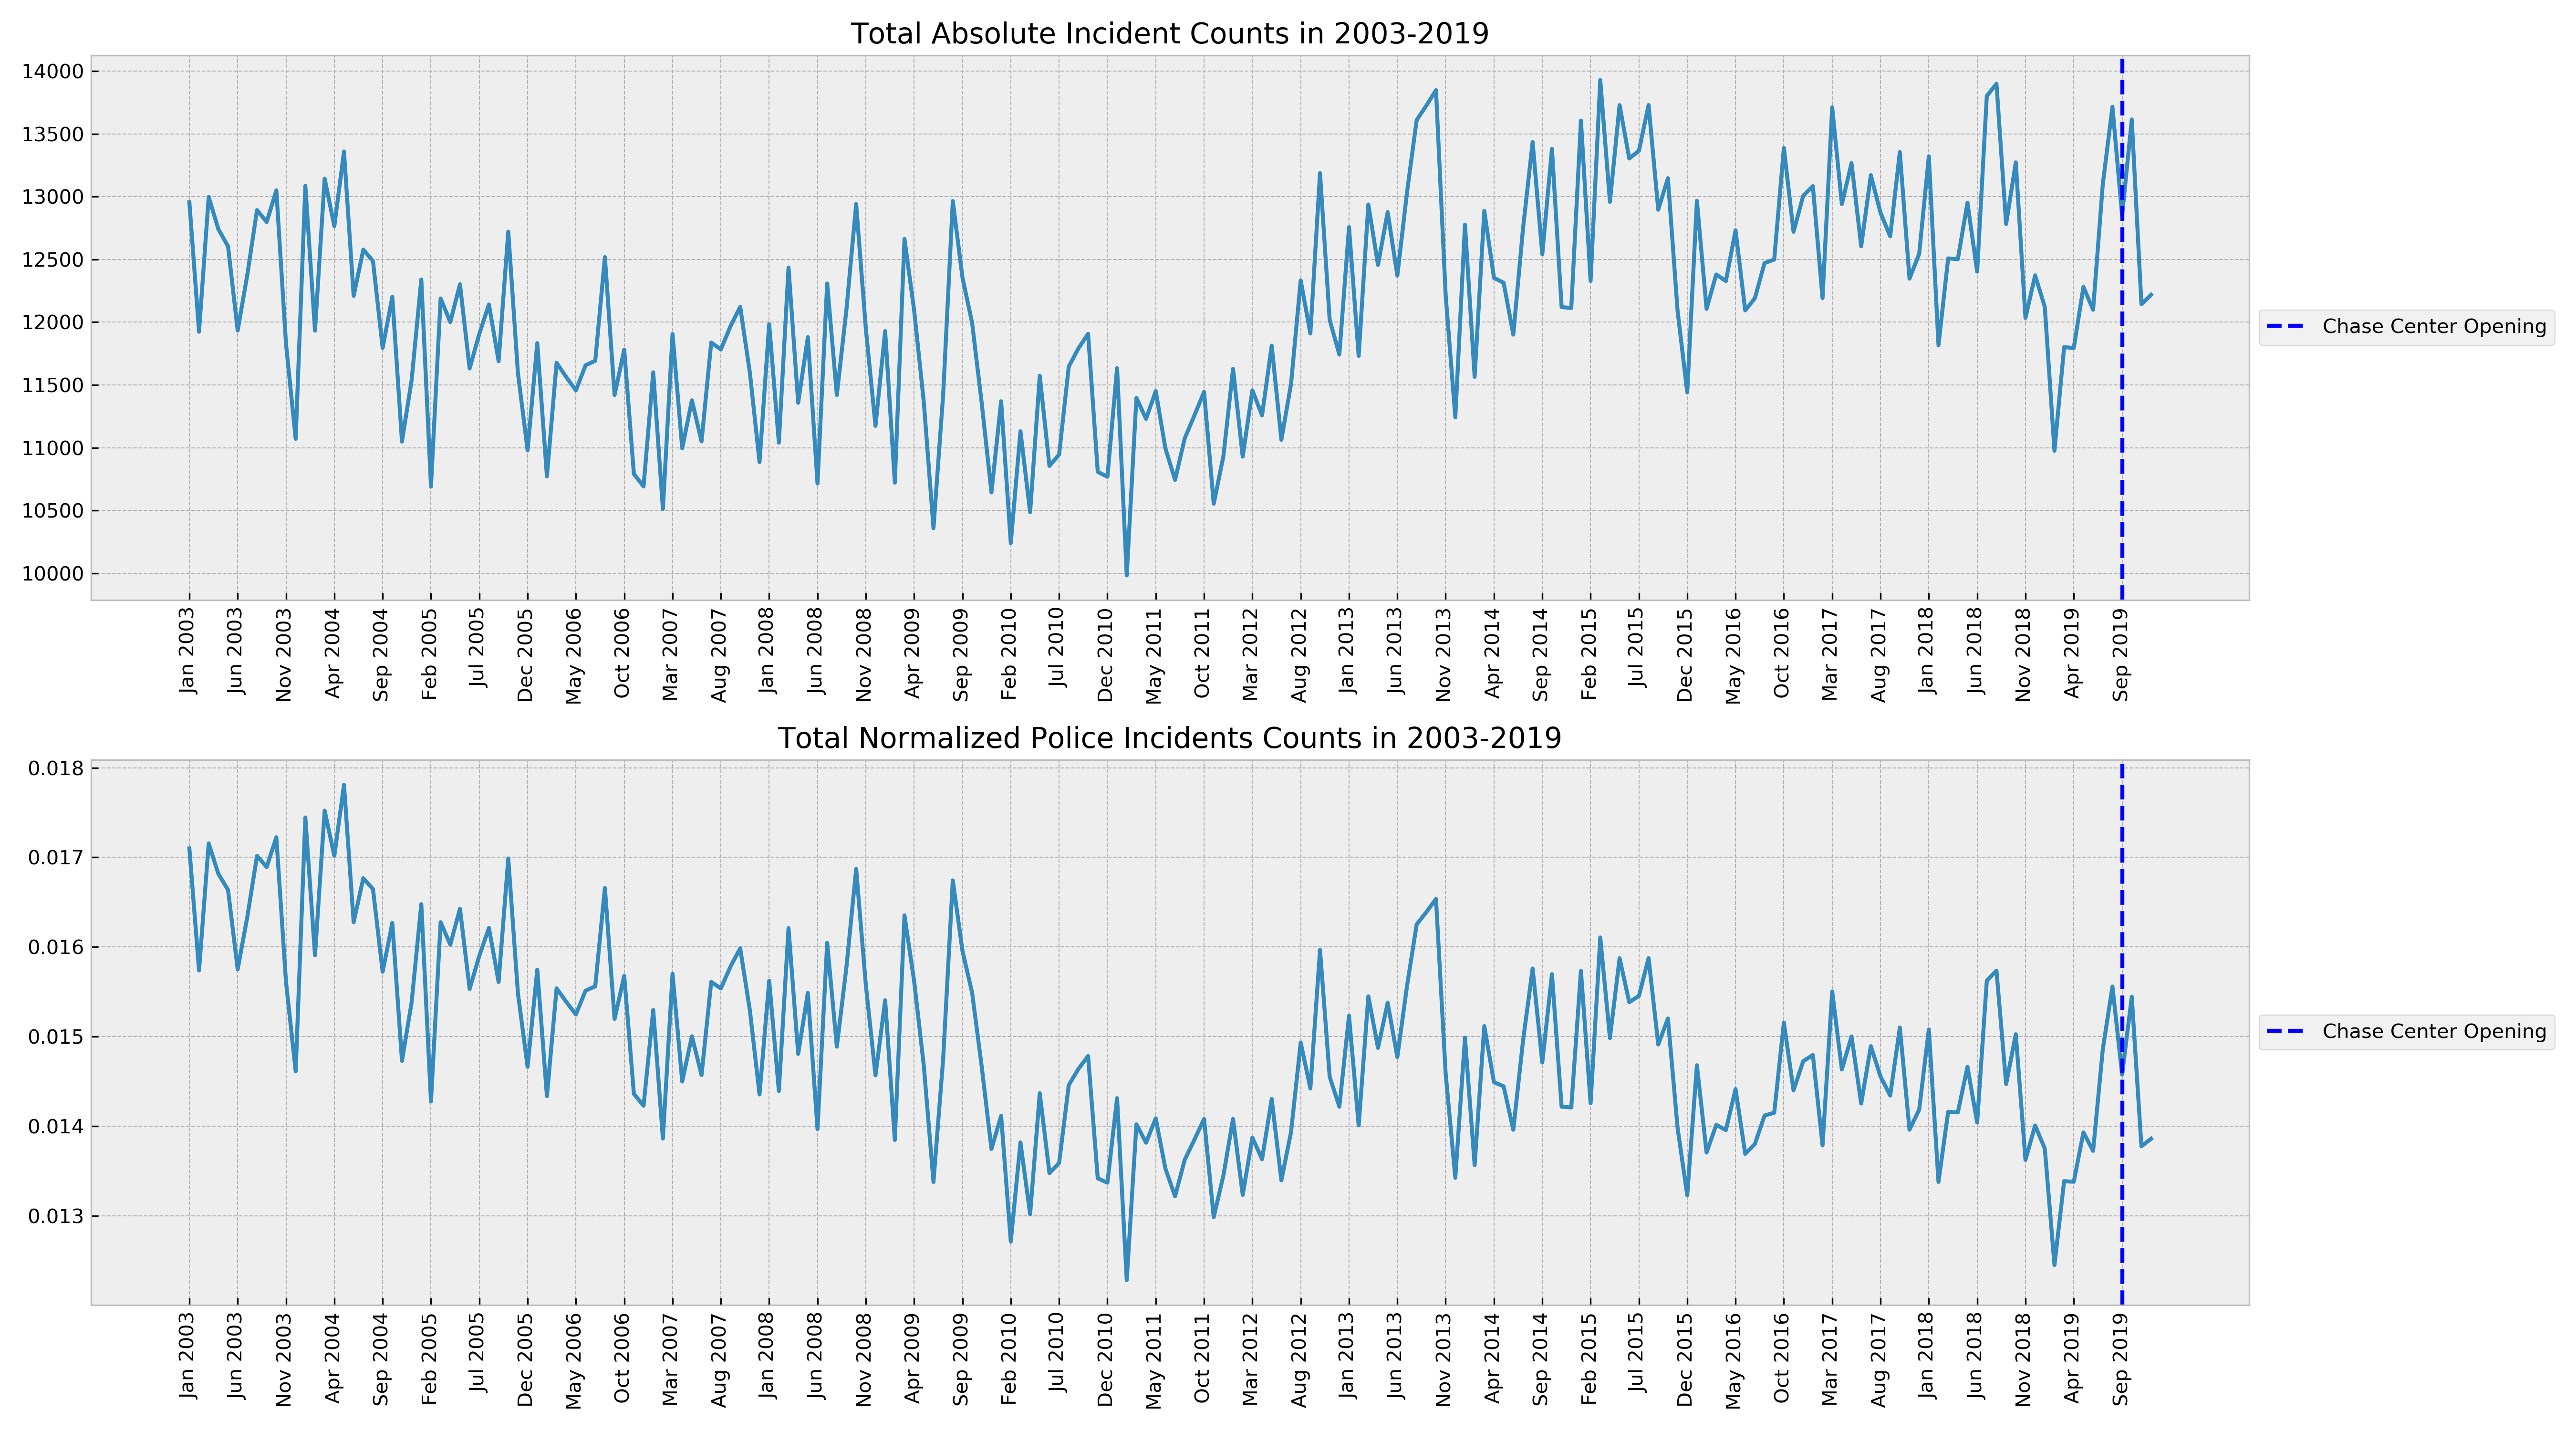
In general, crime experienced a steep decline up until 2011, where it has gradually increased and is relatively flat since 2013 and actually decreasing since the Chase Stadium Opened. Similar seasonality seen with Fire Department Calls, though it general with normalizing it looks like crime went down.
Dogpatch/Mission Bay Data from before and after Stadium opening
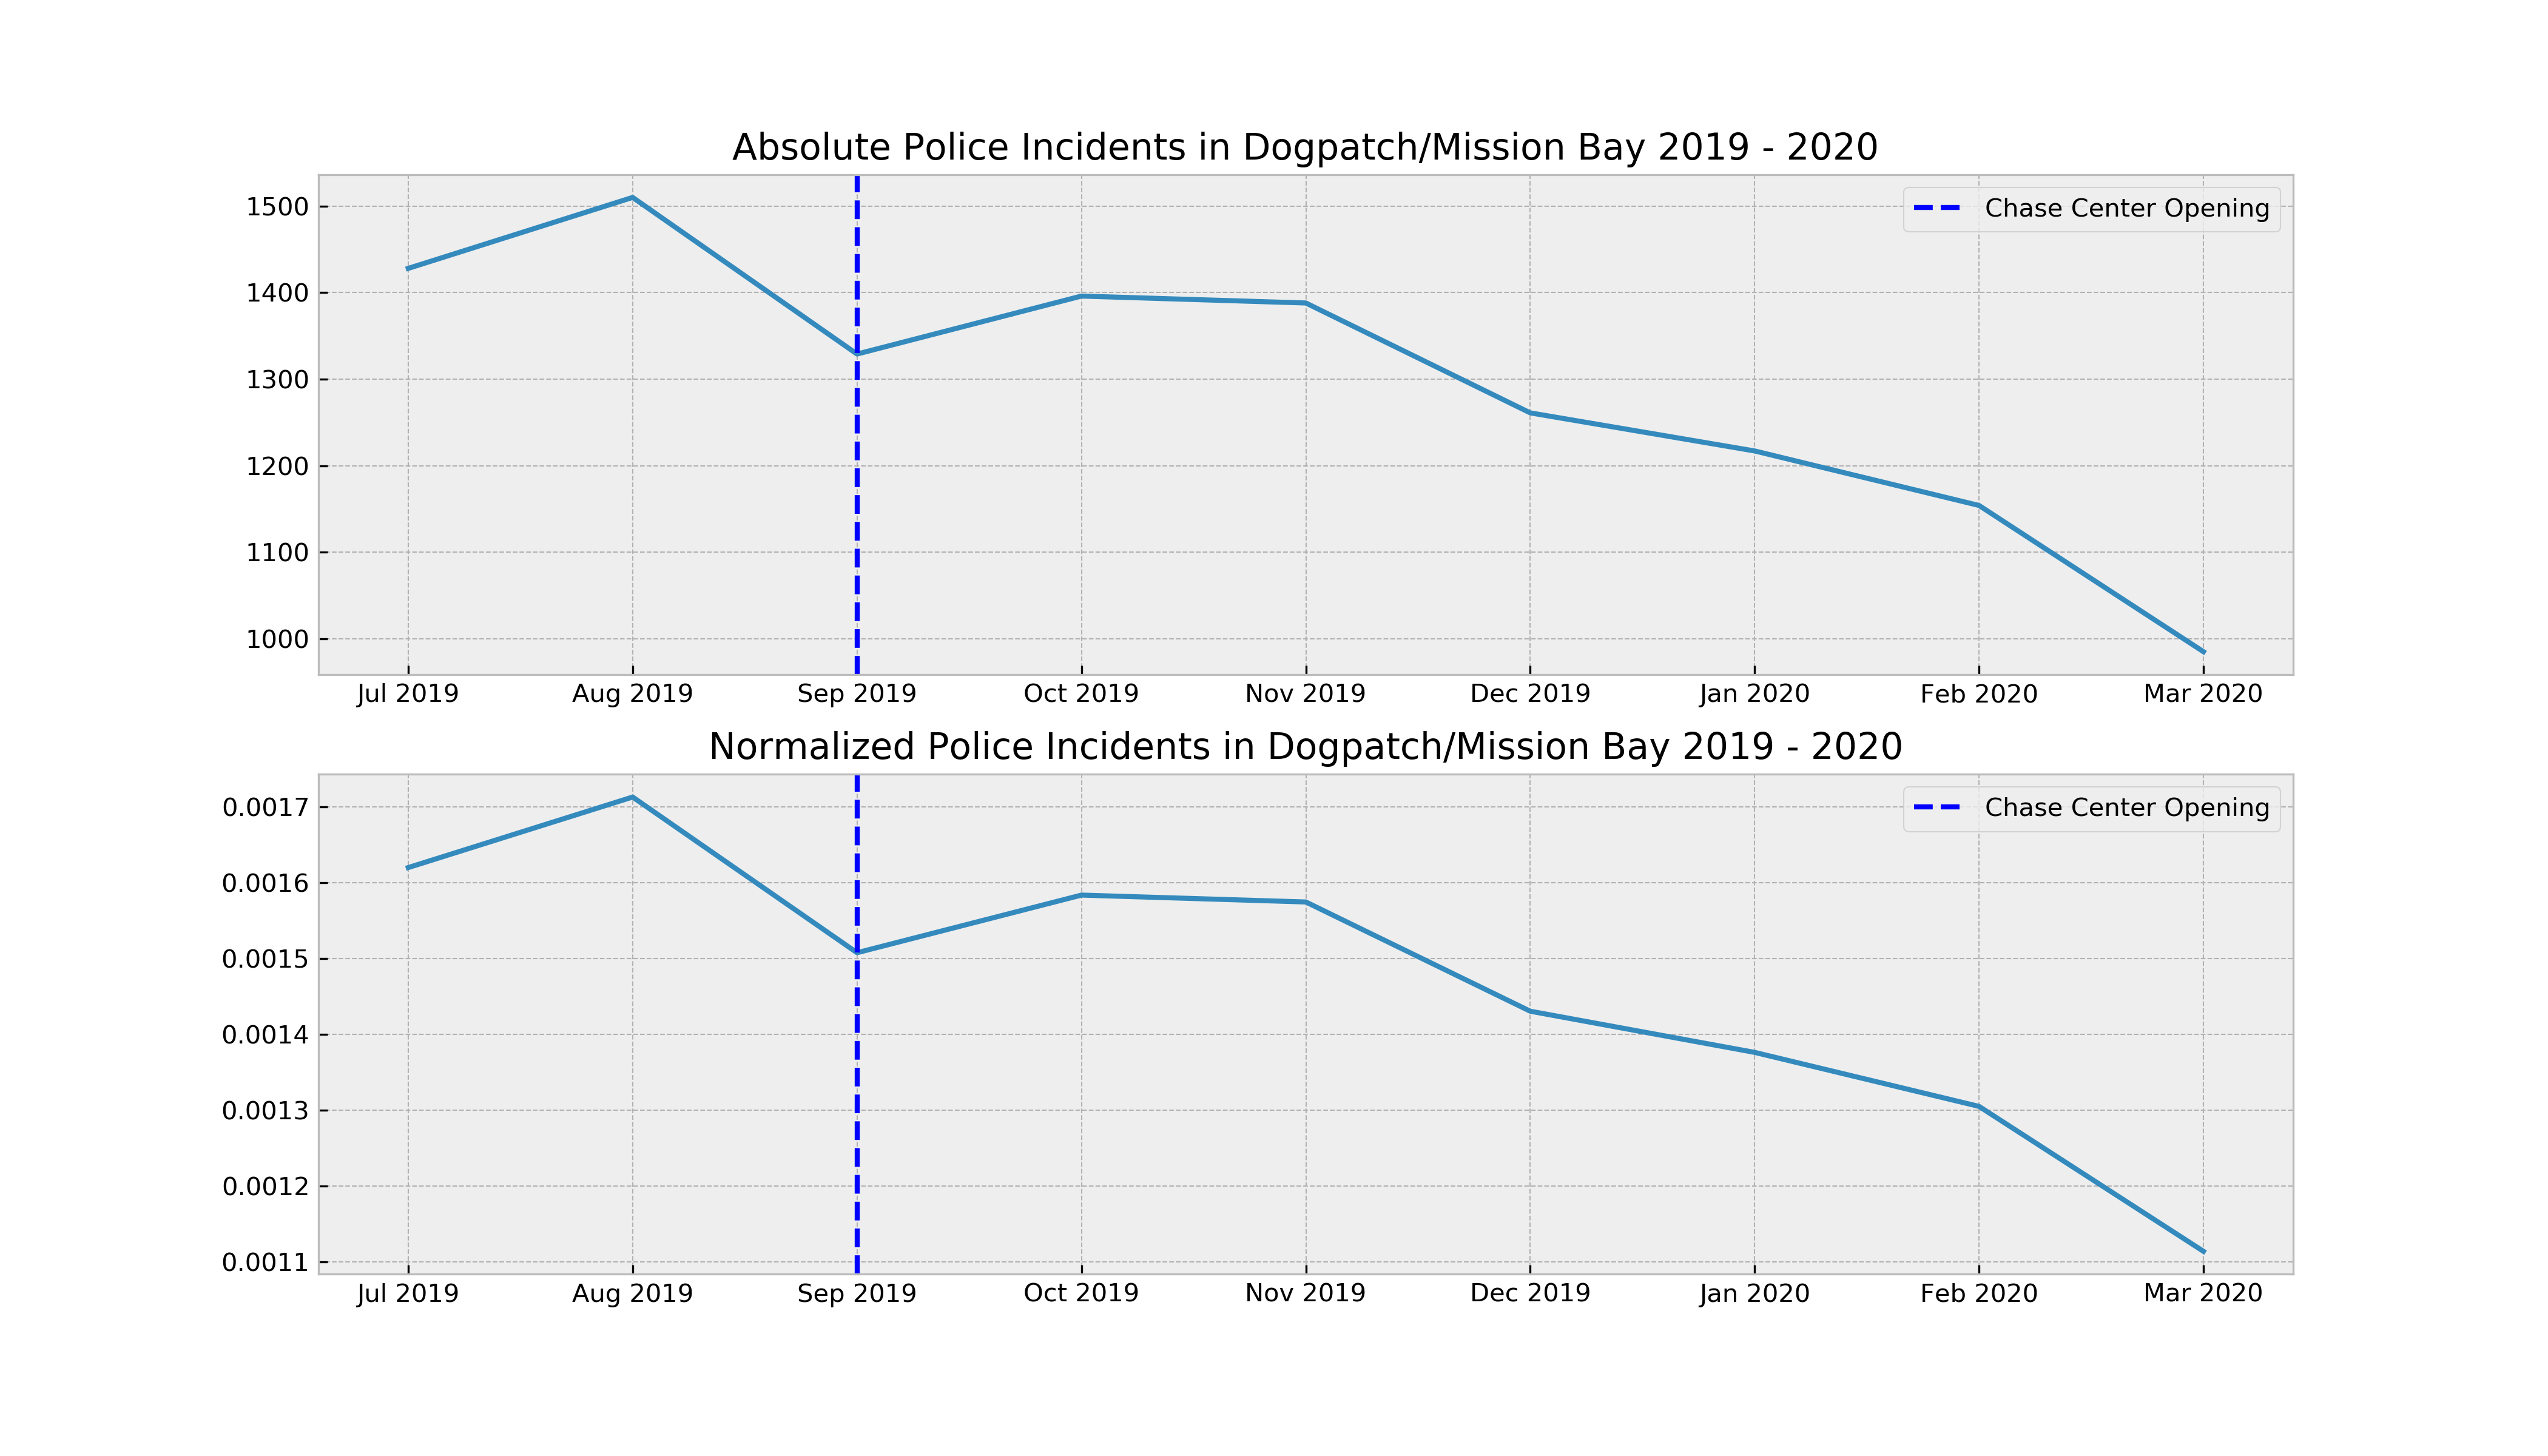
Similar to the Fire Service Call Data, when looking into 2020, the volume seems to have dropped, but unlike the Fire Service Call data, there is not an obvious uptick in the winter, and instead is a gradual dropping of crime.
Dataset 3: Events at Chase Center Stadium Data
Dataset was scraped from ChaseCenter.com/events in the form of a json file
-Data: 92 rows, 25 columns

-Contained the dates & names for each event held at the Chase Stadium since opening.

-Used pandas to cut the json file down to 77 rows & 5 columns of relevant information.
Hypothesis Testing
Null Hypothesis: Fire Department Calls & Police Incidents during event dates = non-event dates
Alternative Hypothesis: Fire Department Calls & Police Incidents during event dates > non-event dates
Alpha: 0.05
Methodology: Conducted MannWhitneyU Test and T-Test on both sample populations (#Calls/Incidents on Event Dates vs. #Calls/Incidents not on event dates), due to different sample sizes & standard deviations.
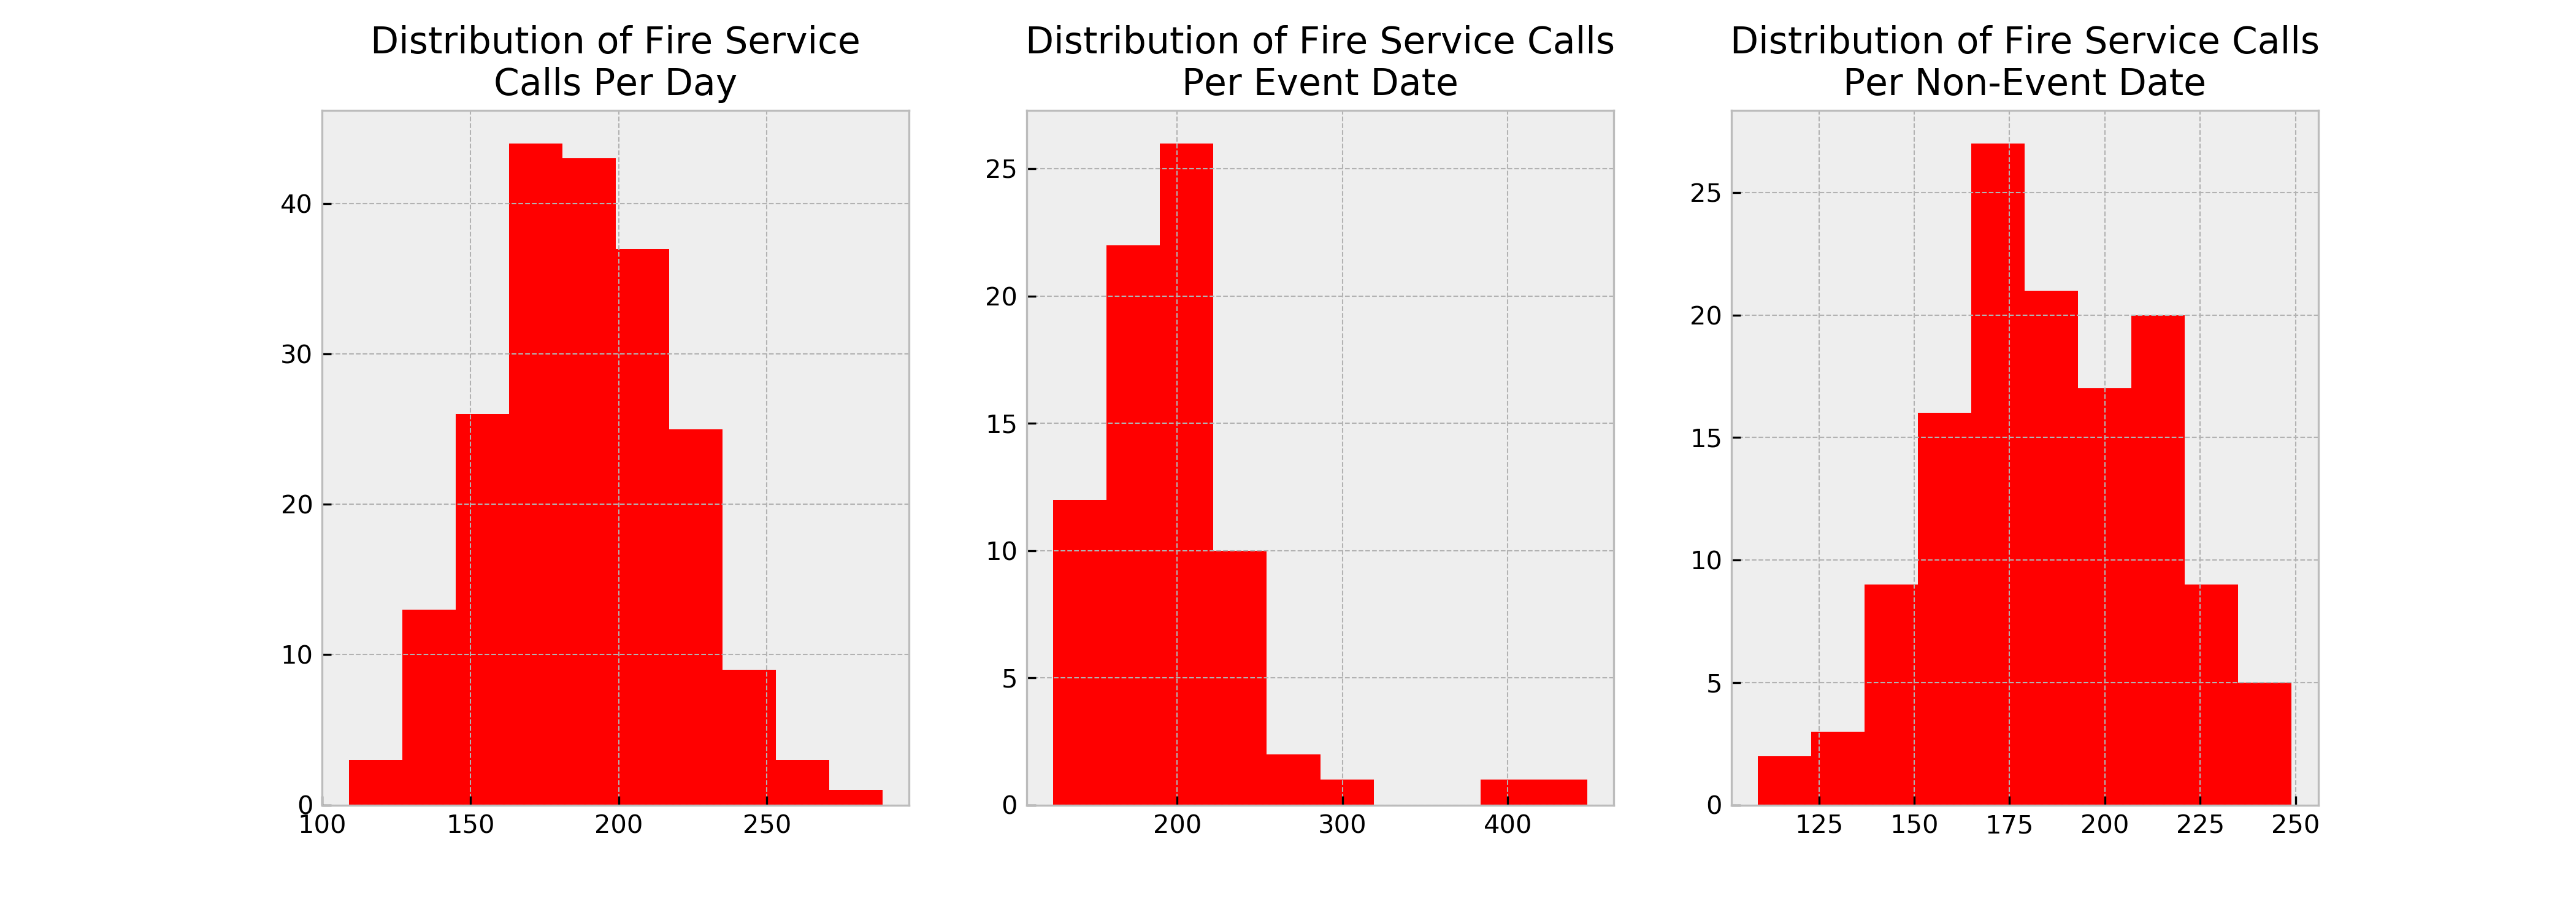
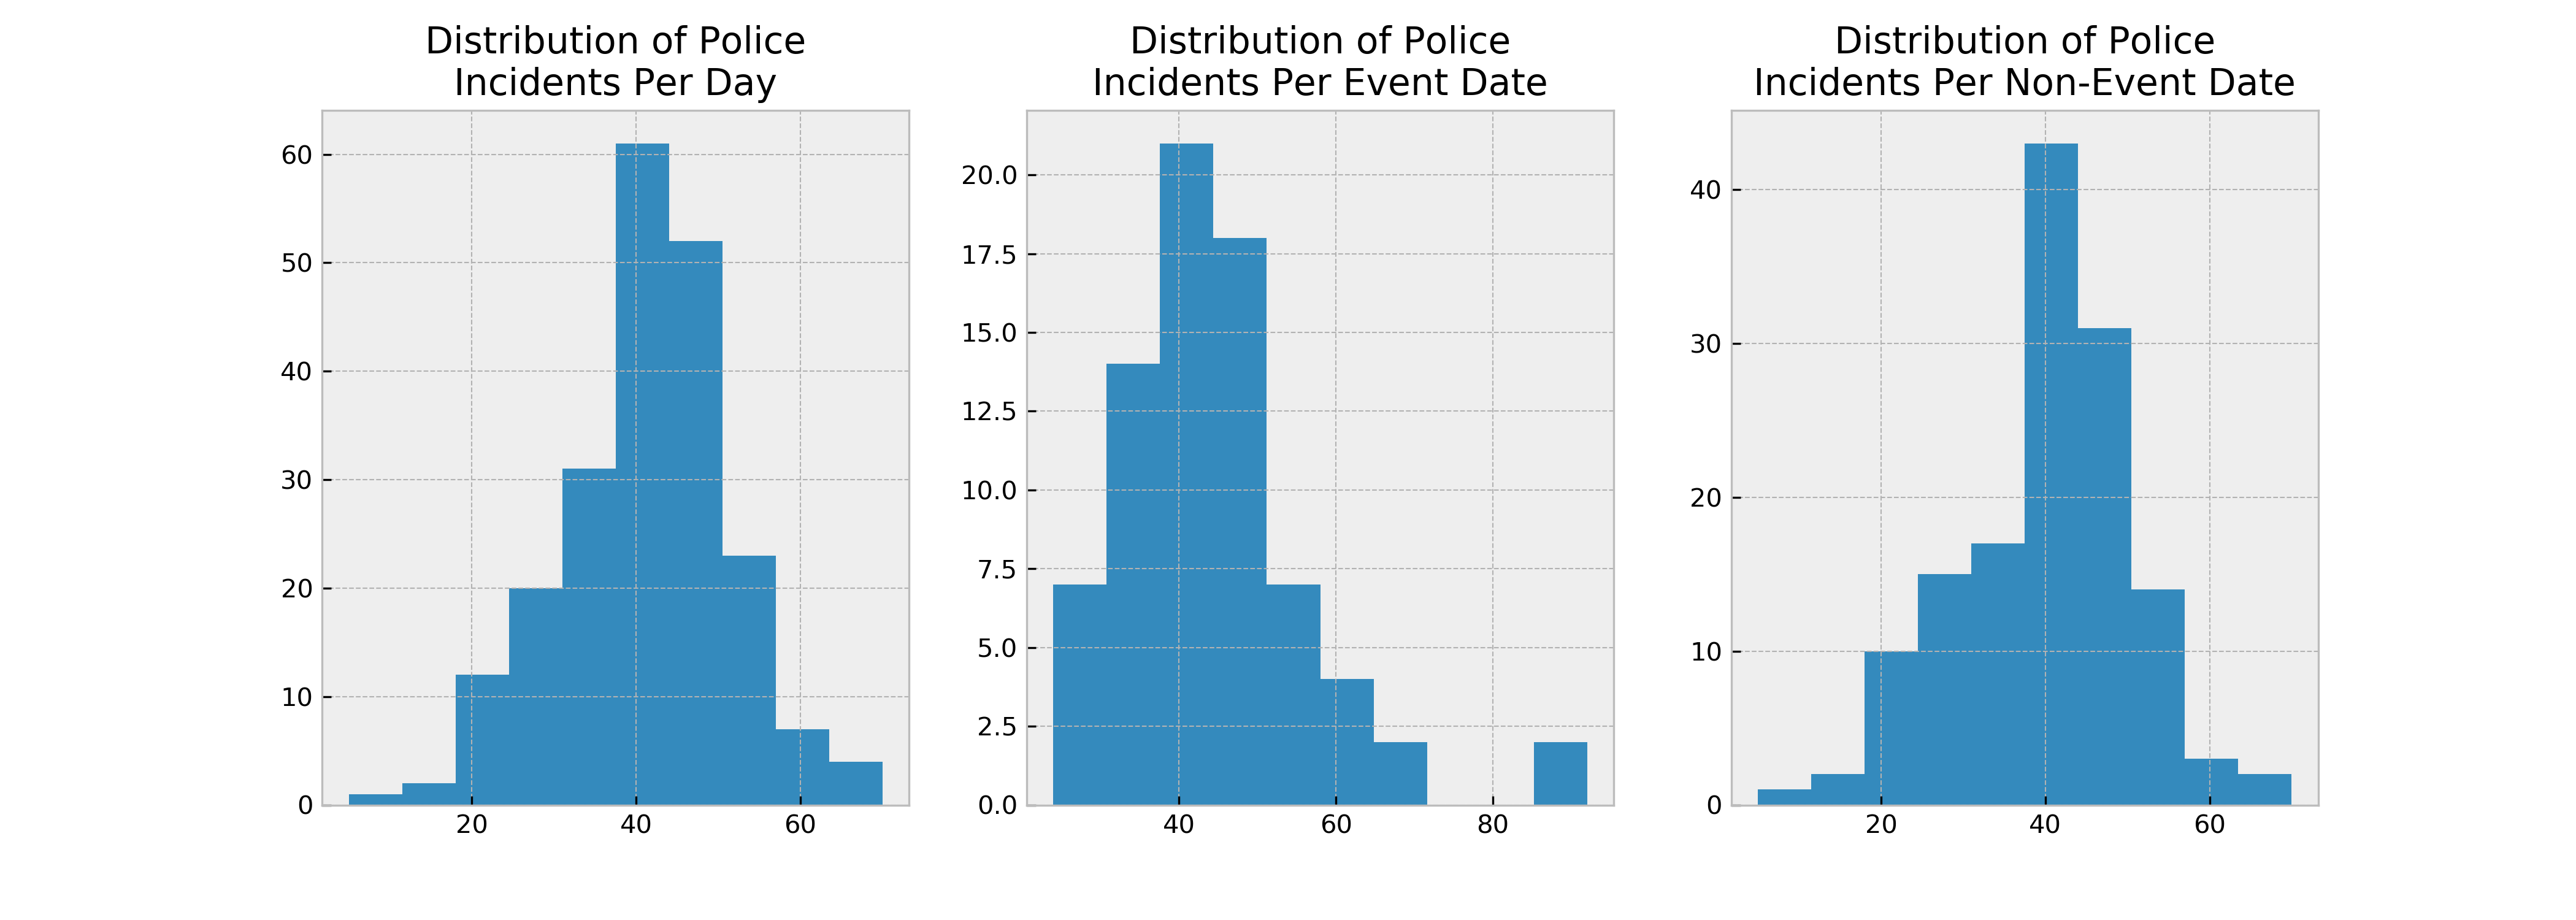
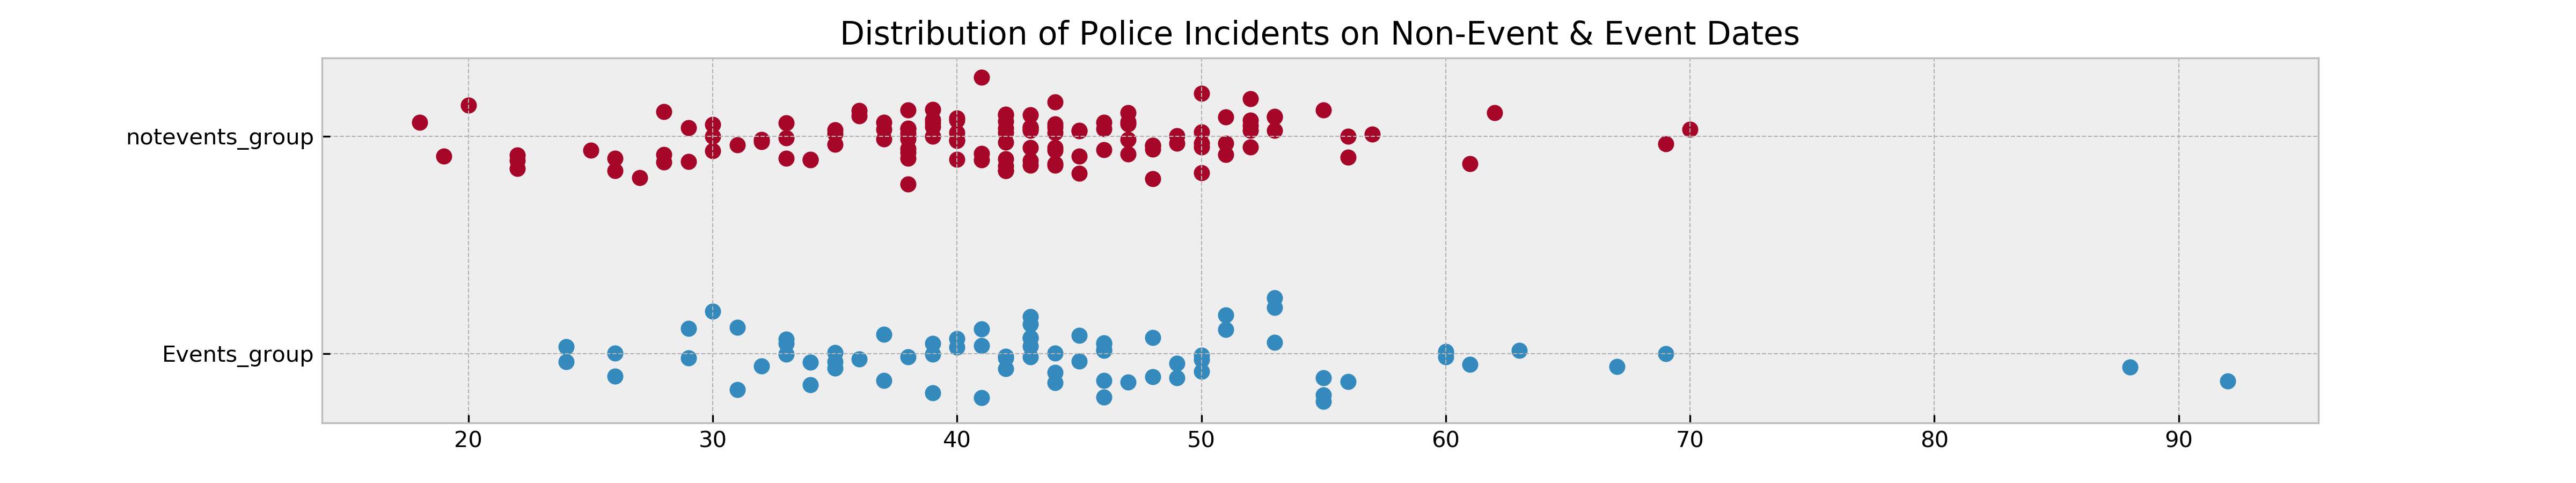
Distribution of Fire Service Calls & Police Incidents were roughly normally distributed, but indicated some outliers.
Below are the distributions prior to removing the outliers. 2 extreme outliers on 12/21/2019 & 1/11/2020 were removed from the datasets before additional analysis.
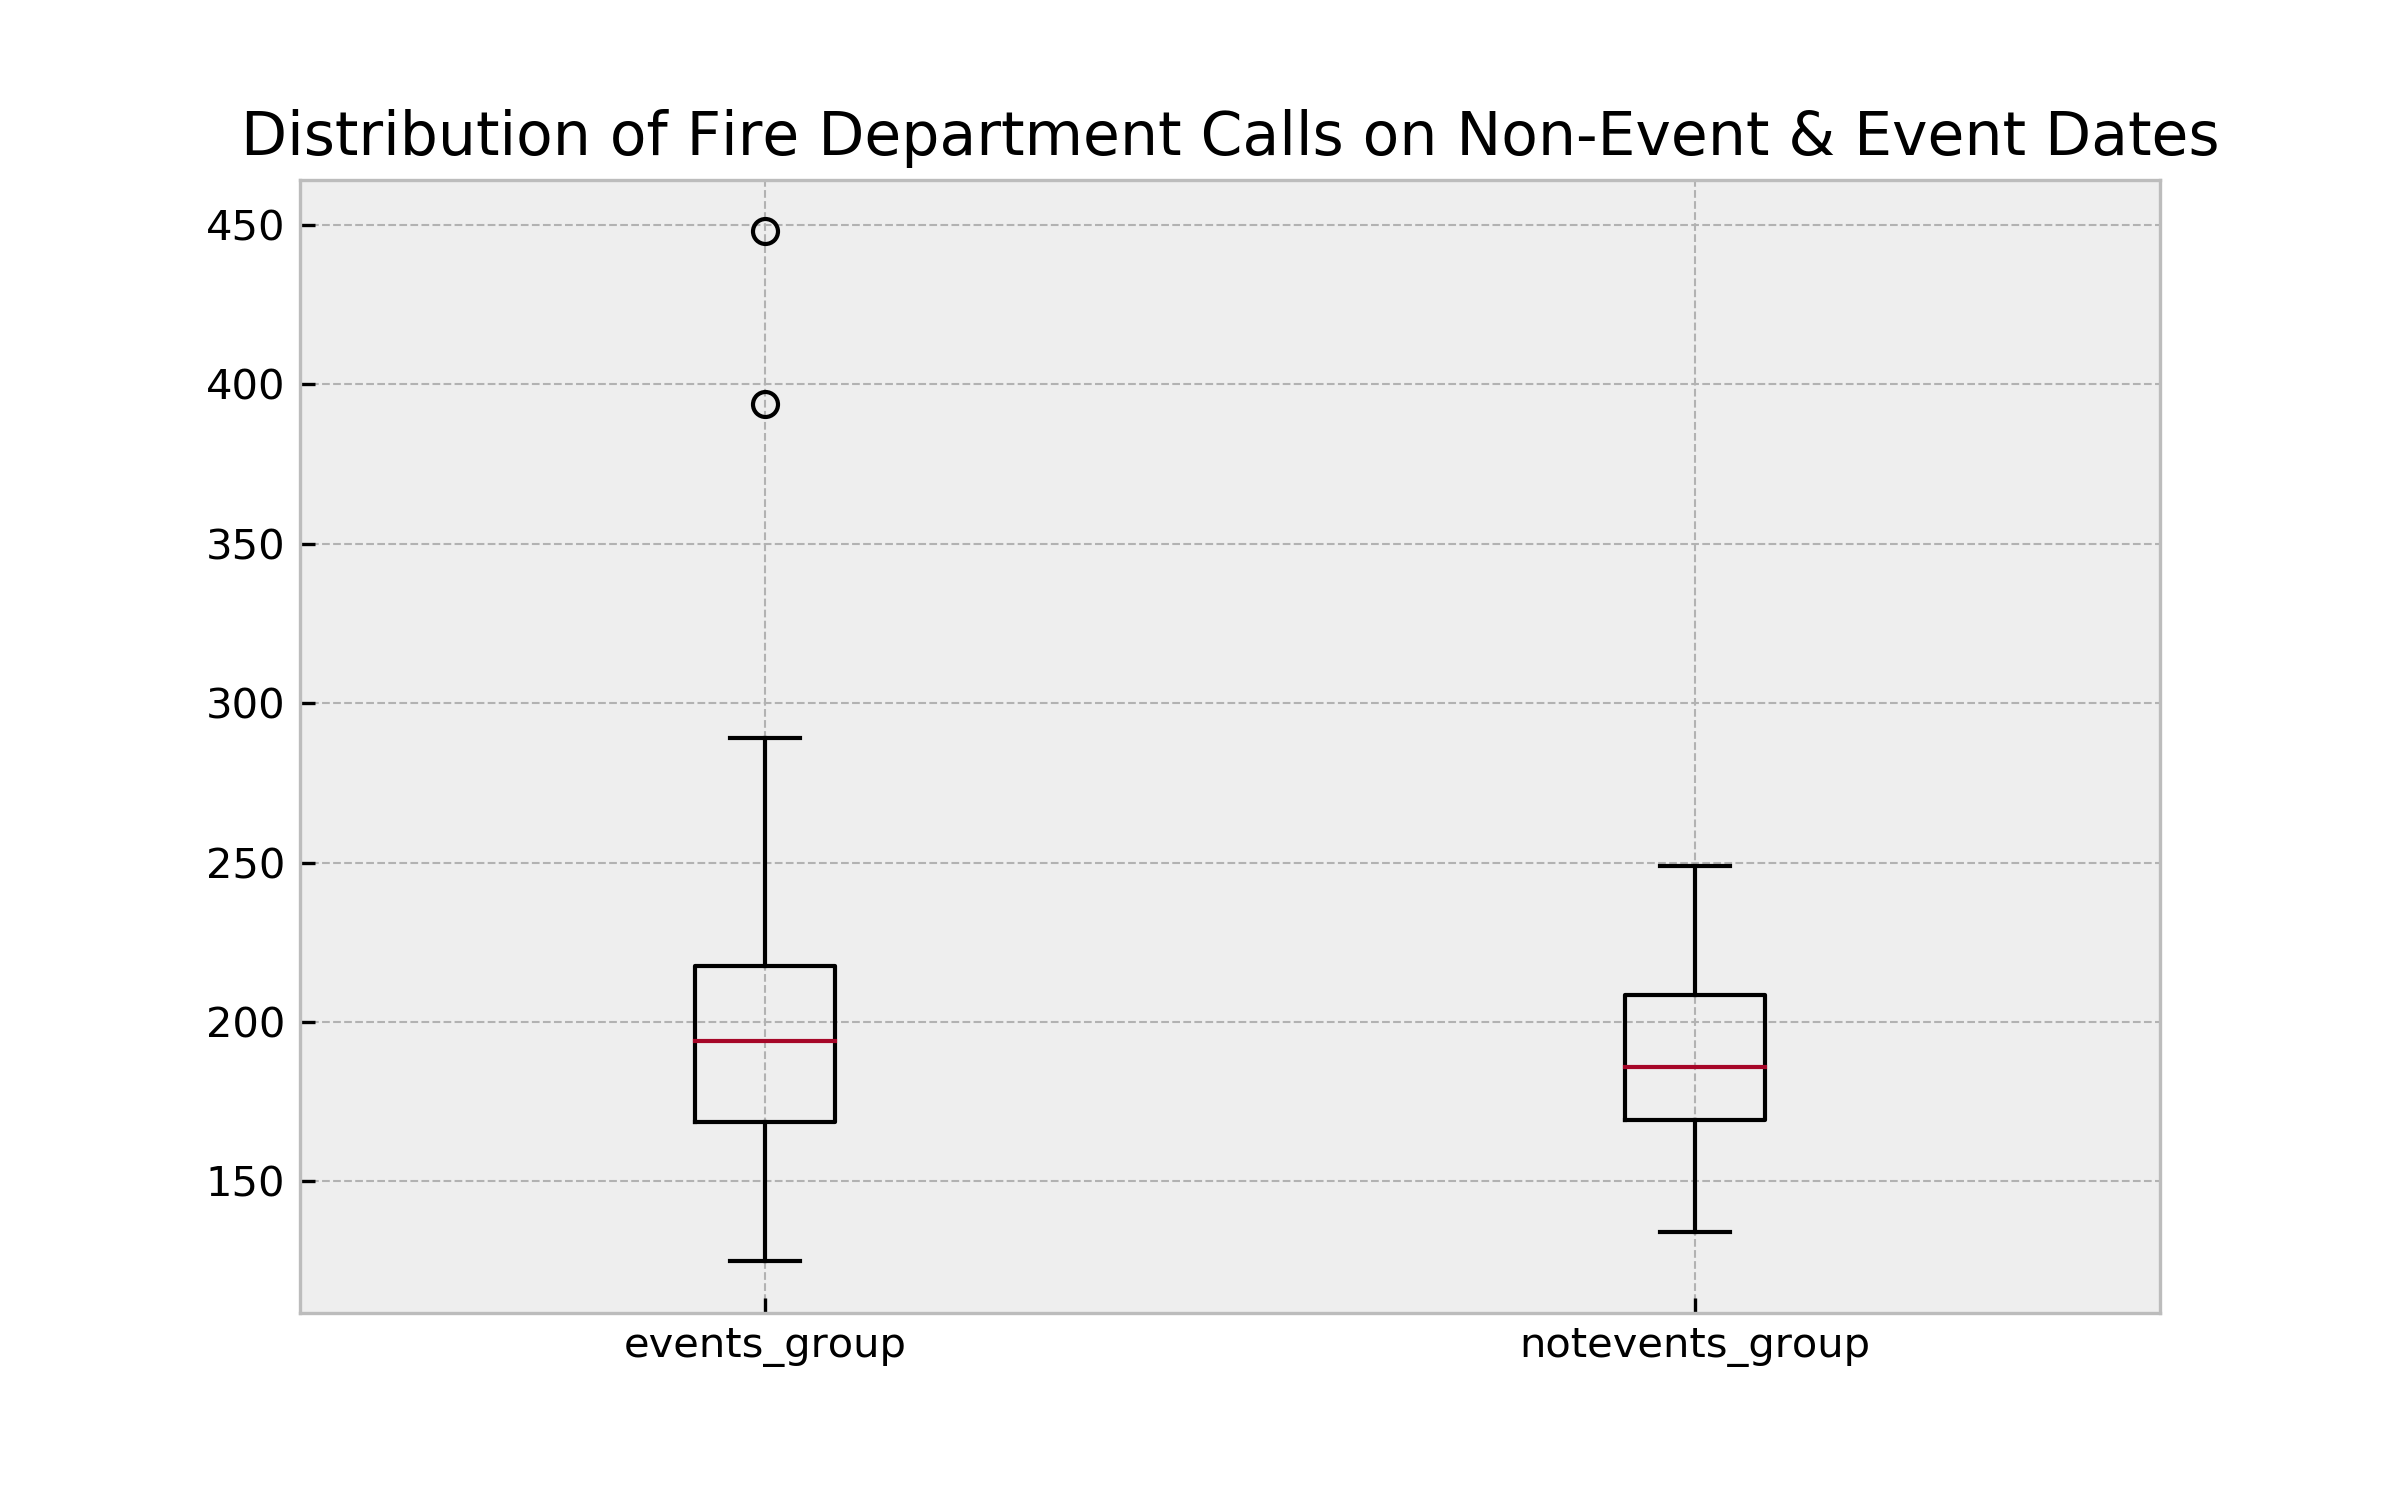
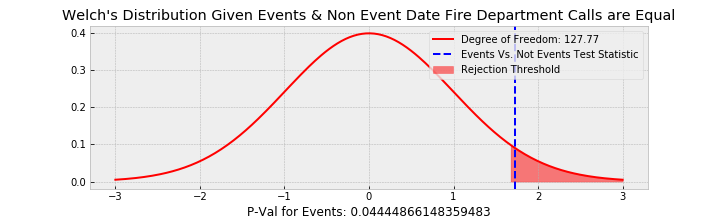
Results: Fire Department Calls
Number of Event Dates: 75, Number of Non-Event Dates: 134
Incidents on Event Dates: 15761, Incidents not on Event Dates: 24776
-MannWhitneyU Test Result : pvalue = 0.069 -> Not-Significant
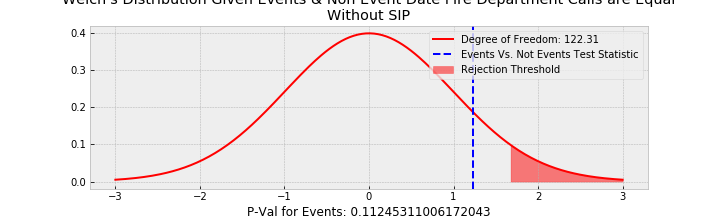
-T-Test Statistic & Distribution: pvalue = 0.044 -> Significant
Based on the T-Test, we can conclude that Event Dates have a higher number of daily Fire Department Service Calls than Non-Event Dates.
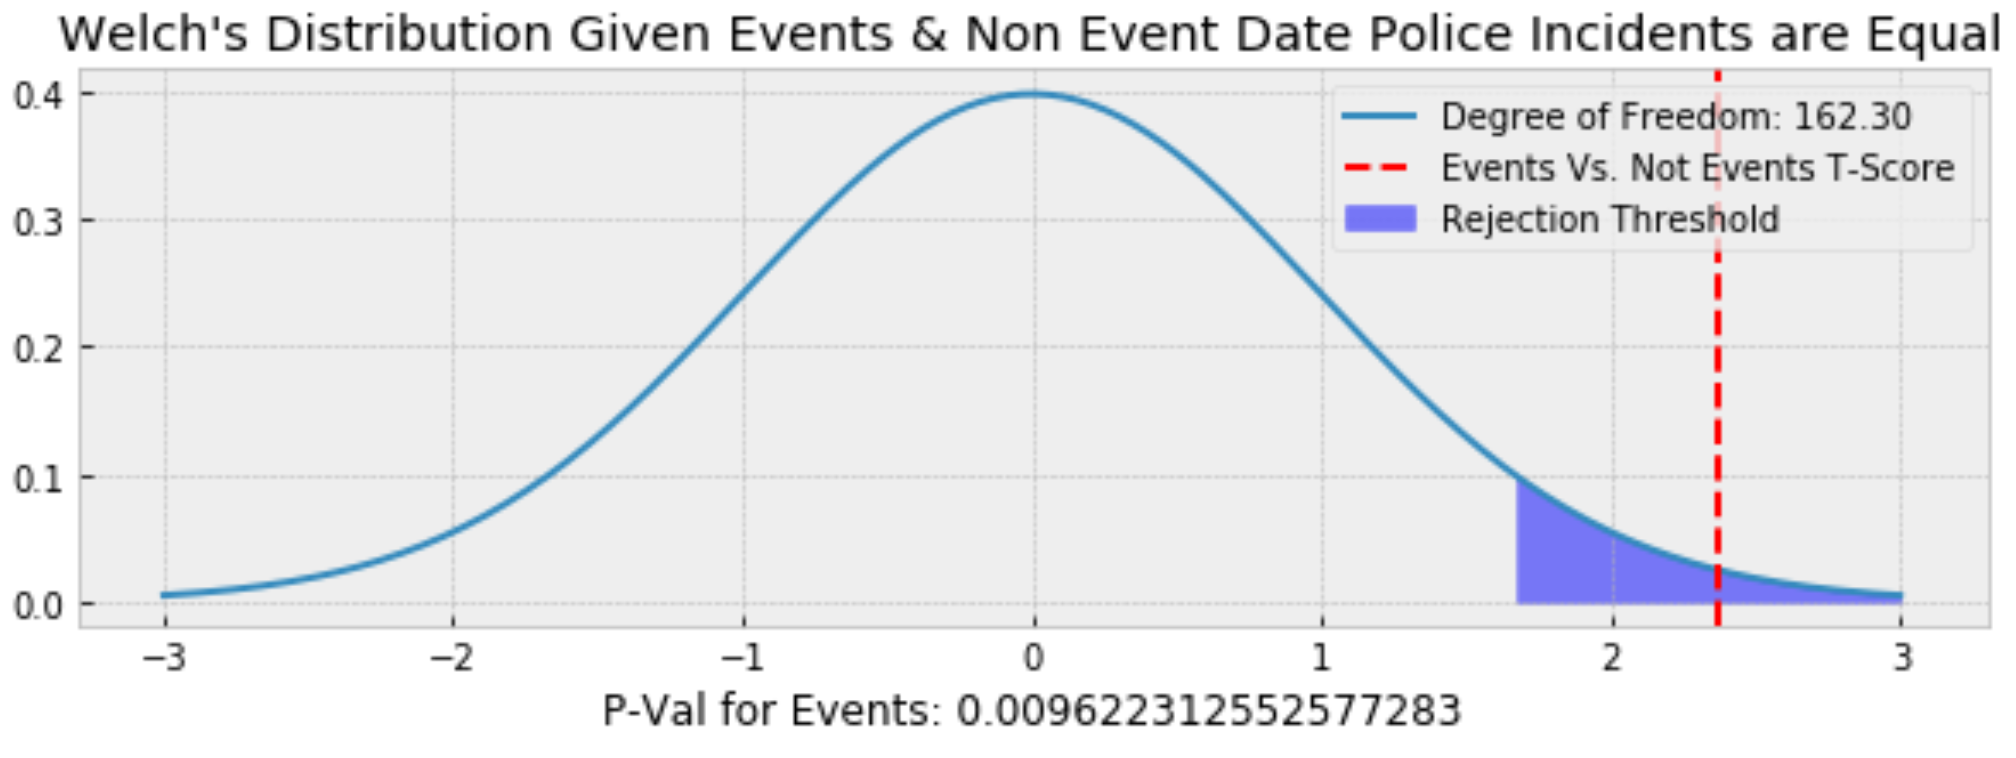
Results: Police Incidents
Number of Event Dates: 75, Number of Non-Event Dates: 138
Incidents on Event Dates: 3337, Incidents not on Event Dates: 5483
-MannWhitneyU Test Result : pvalue = 0.0262 -> Significant
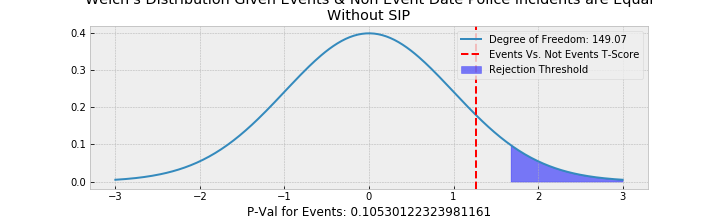
-T-Test Statistic & Distribution: pvalue = 0.0096 -> Significant
Based on the T-Test, we can conclude that Event Dates have a higher number of daily Police Incidents than Non-Event Dates.
What about effects of Shelter In Place?
The data was captured from 9/6/2019 - 3/31/2020. Major Tech companies started having employees work from home around early March, and official Shelter In Place measures were enacted 3/19/2020. How did that impact calls/incidents?
-MannWhitneyU Test Result (Fire Service): pvalue = 0.15 -> Not Significant
-MannWhitneyU Test Result (Police Incidents): pvalue = 0.10 -> Not Significant
-T-Test Statistic & Distribution (Fire Service) : pvalue = 0.11 -> Not Significant
-T-Test Statistic & Distribution (Police Incidents) : pvalue = 0.11 -> Not Significant
Based on the results of all hypothesis tests after accounting for Shelter In Place, we can conclude that there is not a significant difference in the daily Fire Department Service Call volume or Police Incidents between Event & Non-event dates.
Bonus: Basketball, or Concerts - Which causes more trouble?
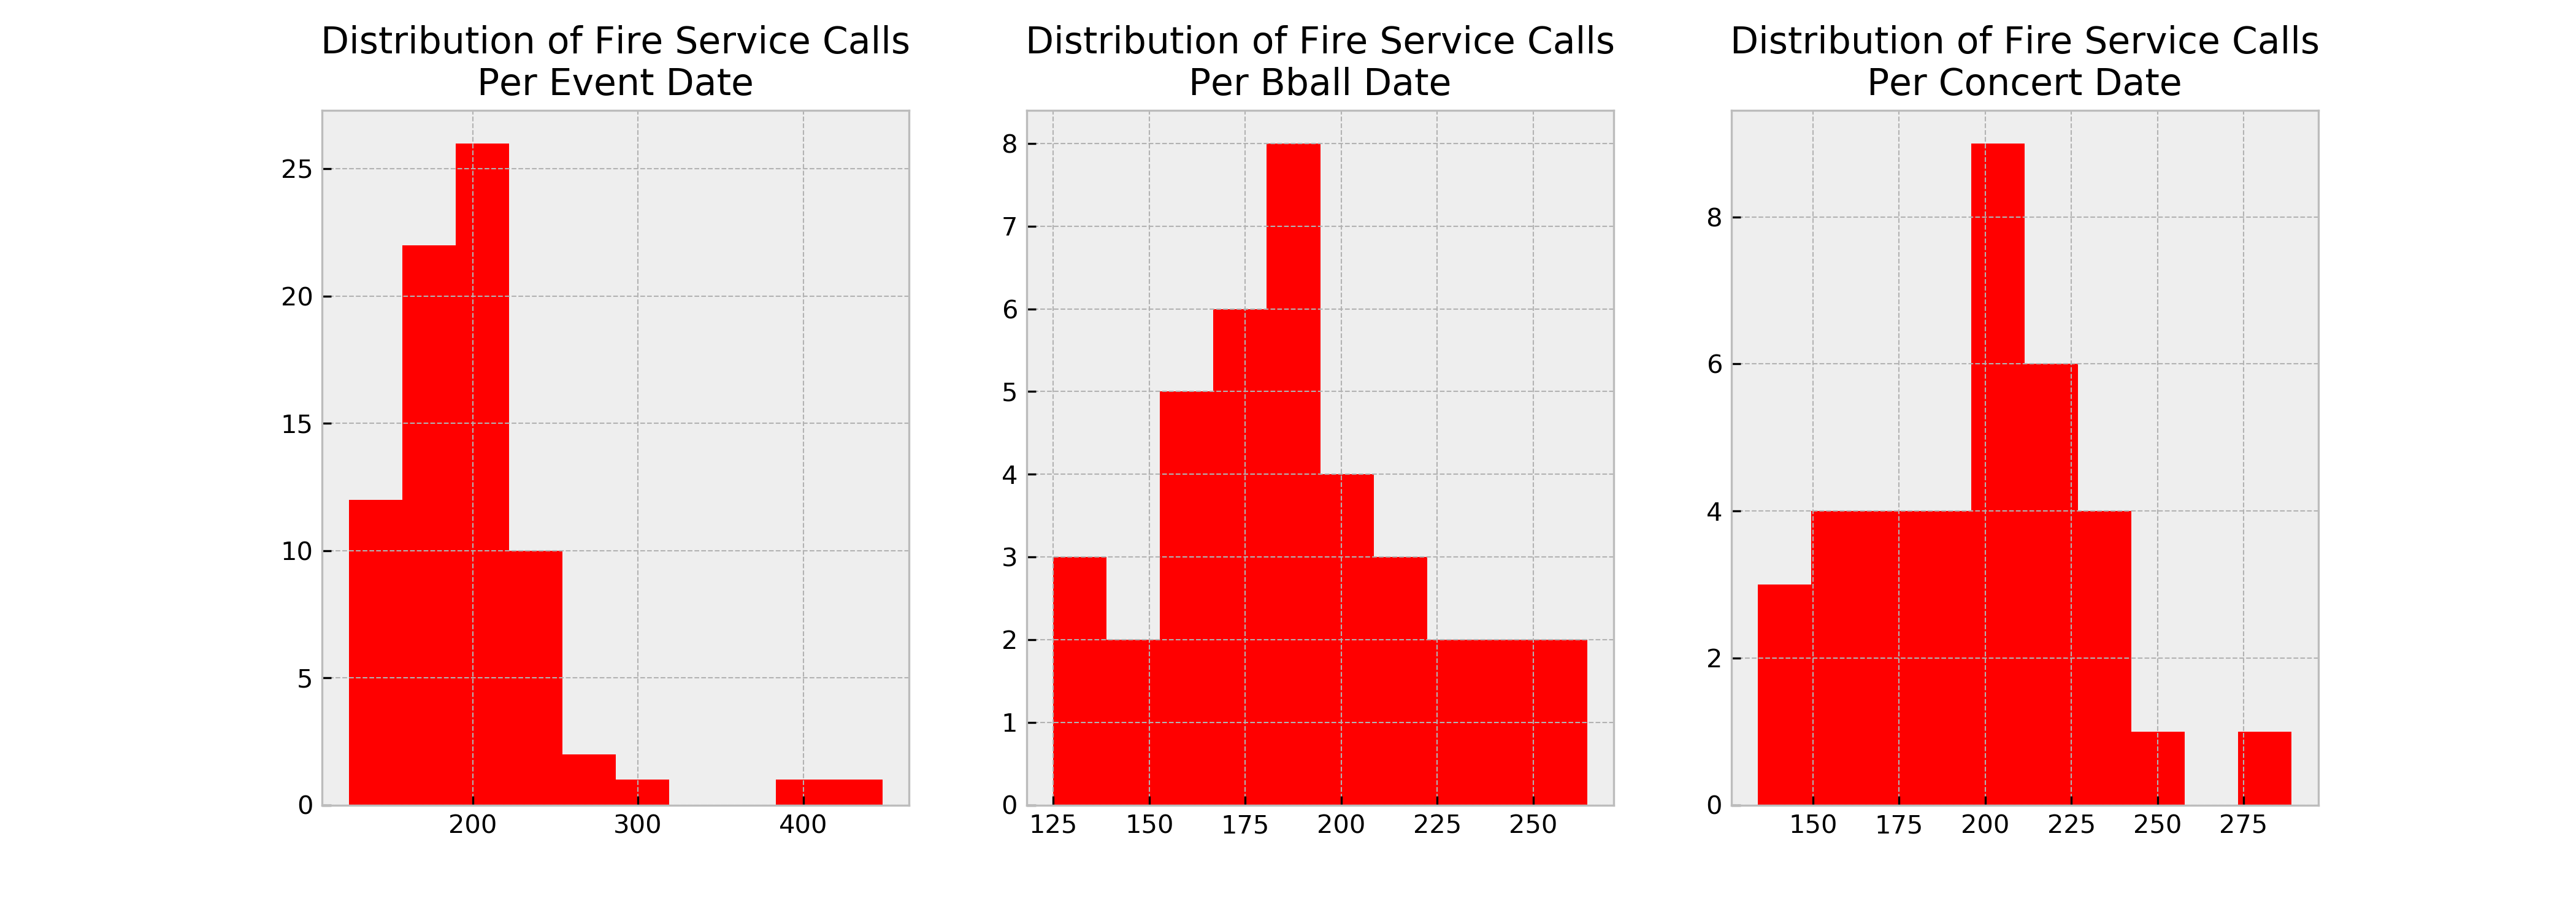
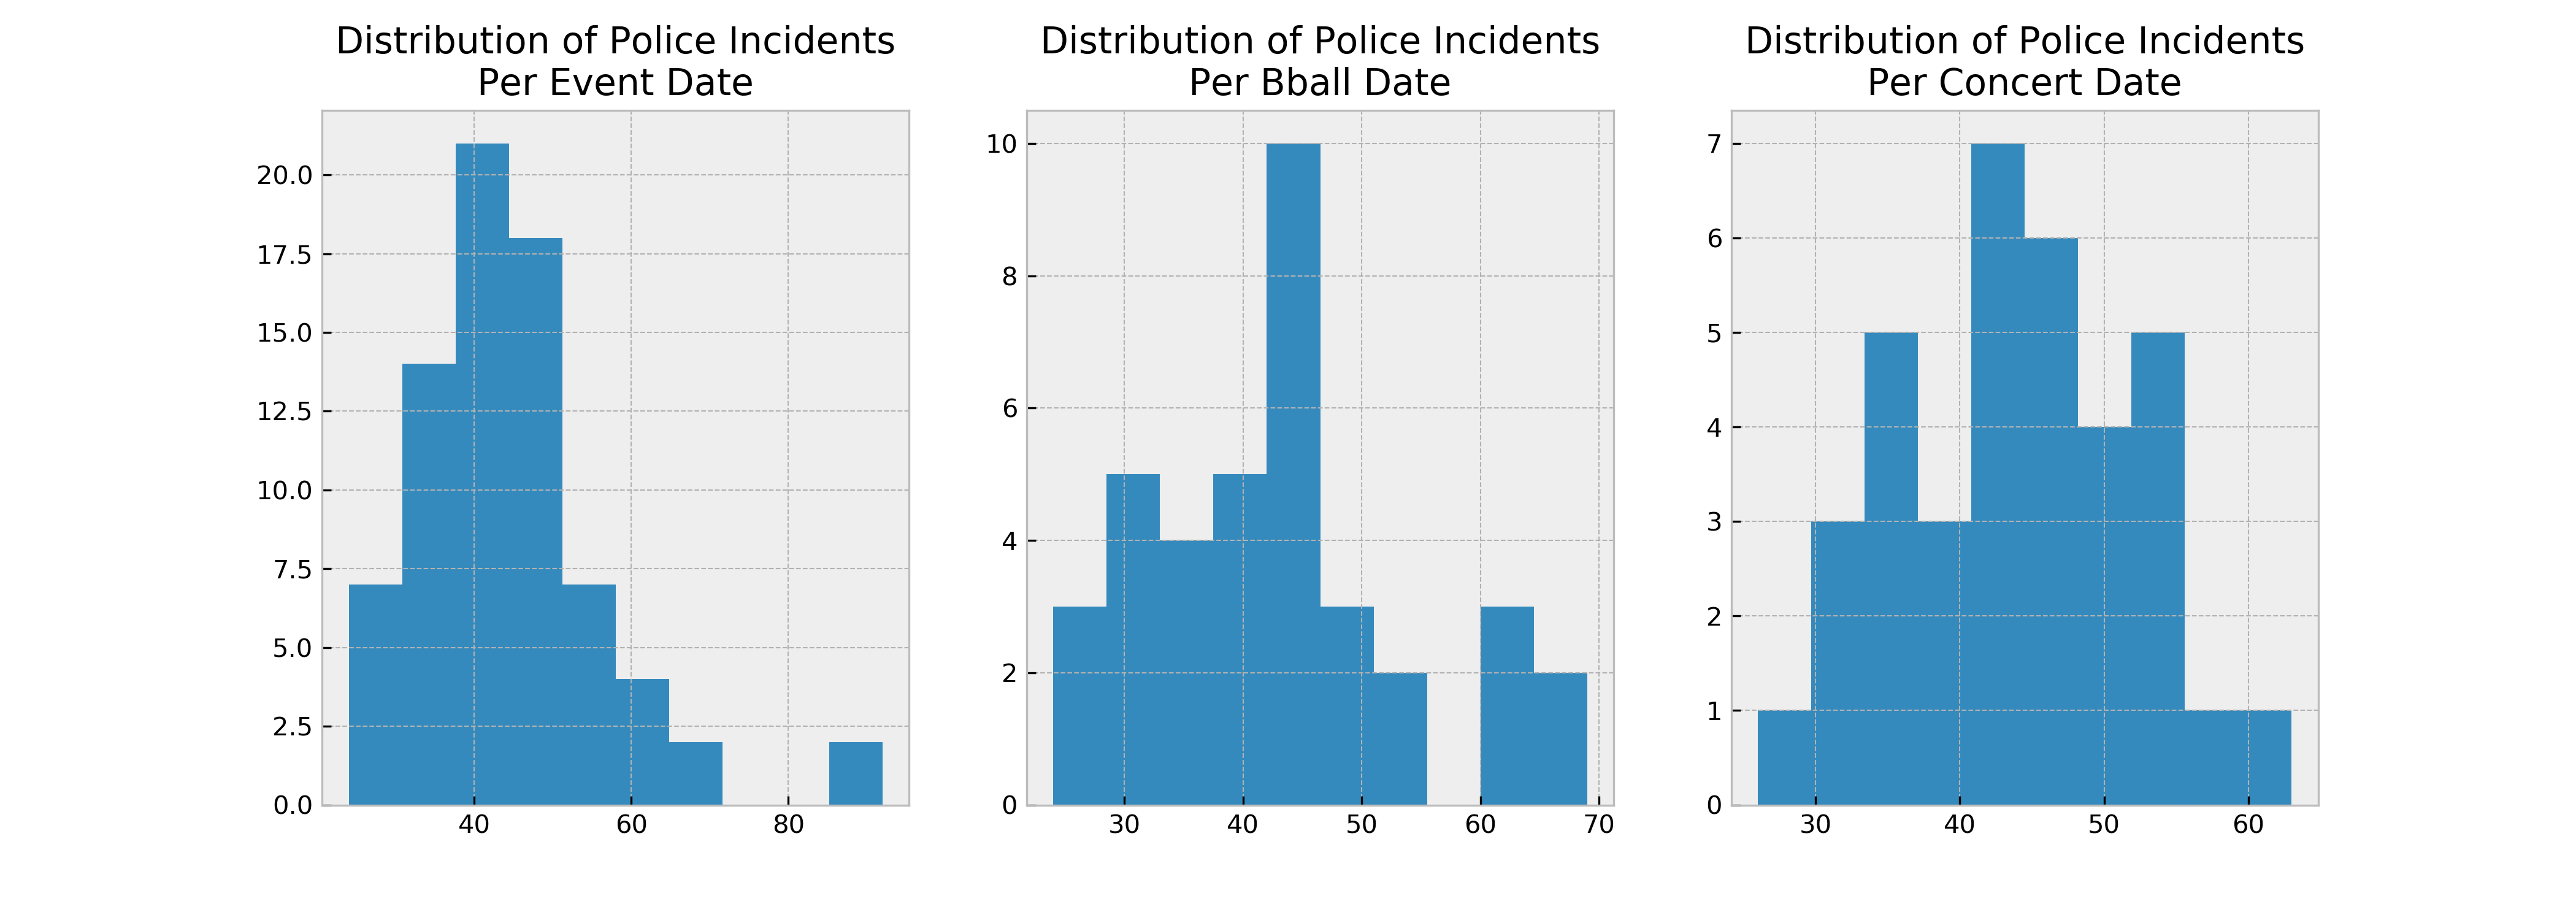
-MannWhitneyU Test Result (Fire Service): pvalue = 0.078 -> Not Significant
-MannWhitneyU Test Result (Police Incidents): pvalue = 0.16 -> Not Significant
-T-Test Statistic & Distribution (Fire Service) : pvalue = 0.10 -> Not Significant
-T-Test Statistic & Distribution (Police Incidents) : pvalue = 0.26 -> Not Significant
No significant difference between Basketball Events or Concerts in Fire Department Call volume or Police Incidents.
Conclusion: Sports fans are only congesting public transit, and not much else.
1. No significant difference in police incidents of fire department call volume on dates with events at the Chase Center.
2. Shelter in Place has had a significant impact on decreasing call volume & incidents.
3. No significant difference between basketball events and concerts on police incidents or call volume.
Assumptions Made & Caveats….
-Data was normalized using annual population for SF as a whole, not drilled down to zipcode.
-The Chase Center Stadium opened in September of 2019, and due to Shelter In Place, the months for observation and comparison are only 5 months.
Looked into the week days of events versus non events in case the distribution of events was majority on weekends, which I hypothesize would have higher incidents/fire calls in general. Events were biased towards Saturdays with 25% of Events on Saturdays.
Day of Week Events Distribution:
Monday: 0.13
Tuesday: 0.12
Wednesday: 0.13
Thursday: 0.16
Friday: 0.12
Saturday: 0.26
Sunday: 0.09
Goals for future Analysis:
-Look into Saturdays in particular to compare events versus non-events.
-Compare results again after more time has passed.
-What about the same analysis, but for the Giants games?
In terms of incidents or calls overall, would be interesting to look into
-Time of day or day of week
-What exactly happened on 12/21/2019 & 1/11/2020 that drove both crime & fire so high?
-Why was crime so low in 2010-2012?
-General trends prior to 2018 with the 2003 - 2018 report